Well Charts and Plots
3D Chart Viewer
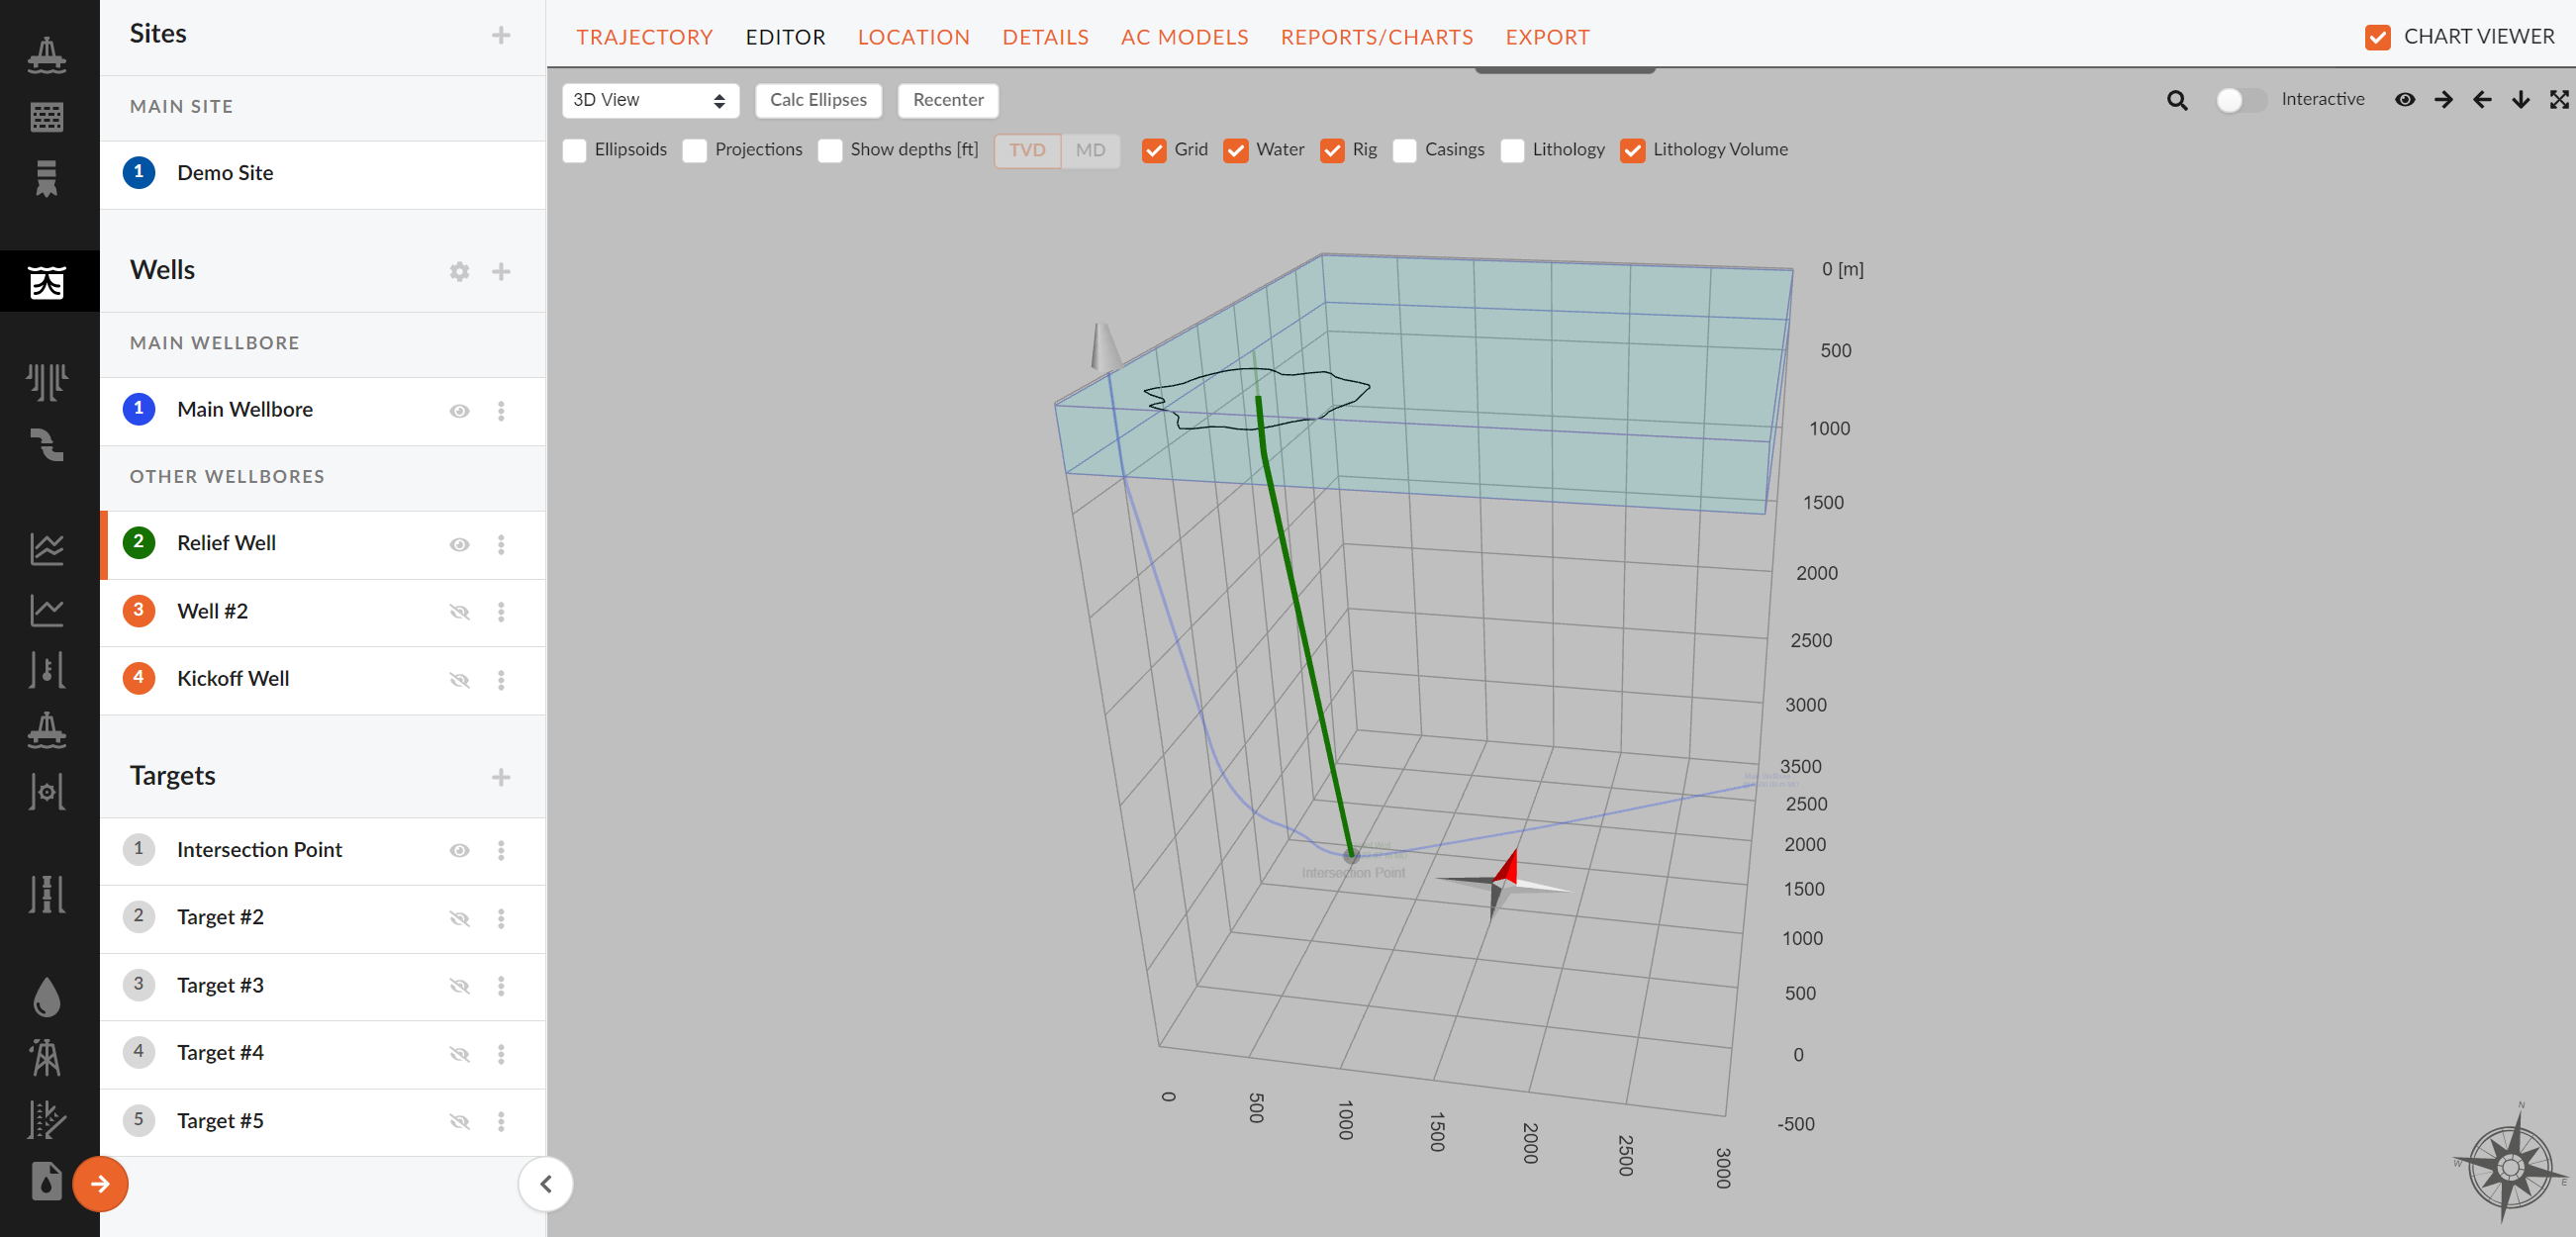
The 3D chart viewer shows all wells and can be accessed in full screen in the "Trajectory Menu".
Operations in the Viewer
| Functions | Explanation |
|---|---|
| Casings/Grid/Lithology/Lithology Volume/Rig/Water | Select any of these options to include them in the viewer |
| Change Focus Point | Hold left mouse button and drag |
| Change View Angle | Hold right mouse button and drag |
| Disable Well Names | Click the "eye" icon top right corner of viewer |
| Full Screen and Views | Use arrows in top right corner |
| Turn on Ellipsoids | Click the 'Calc Ellipses' button top left corner of viewer, then select Ellipsoids |
| Zoom | Scroll with the pointer inside the viewer |
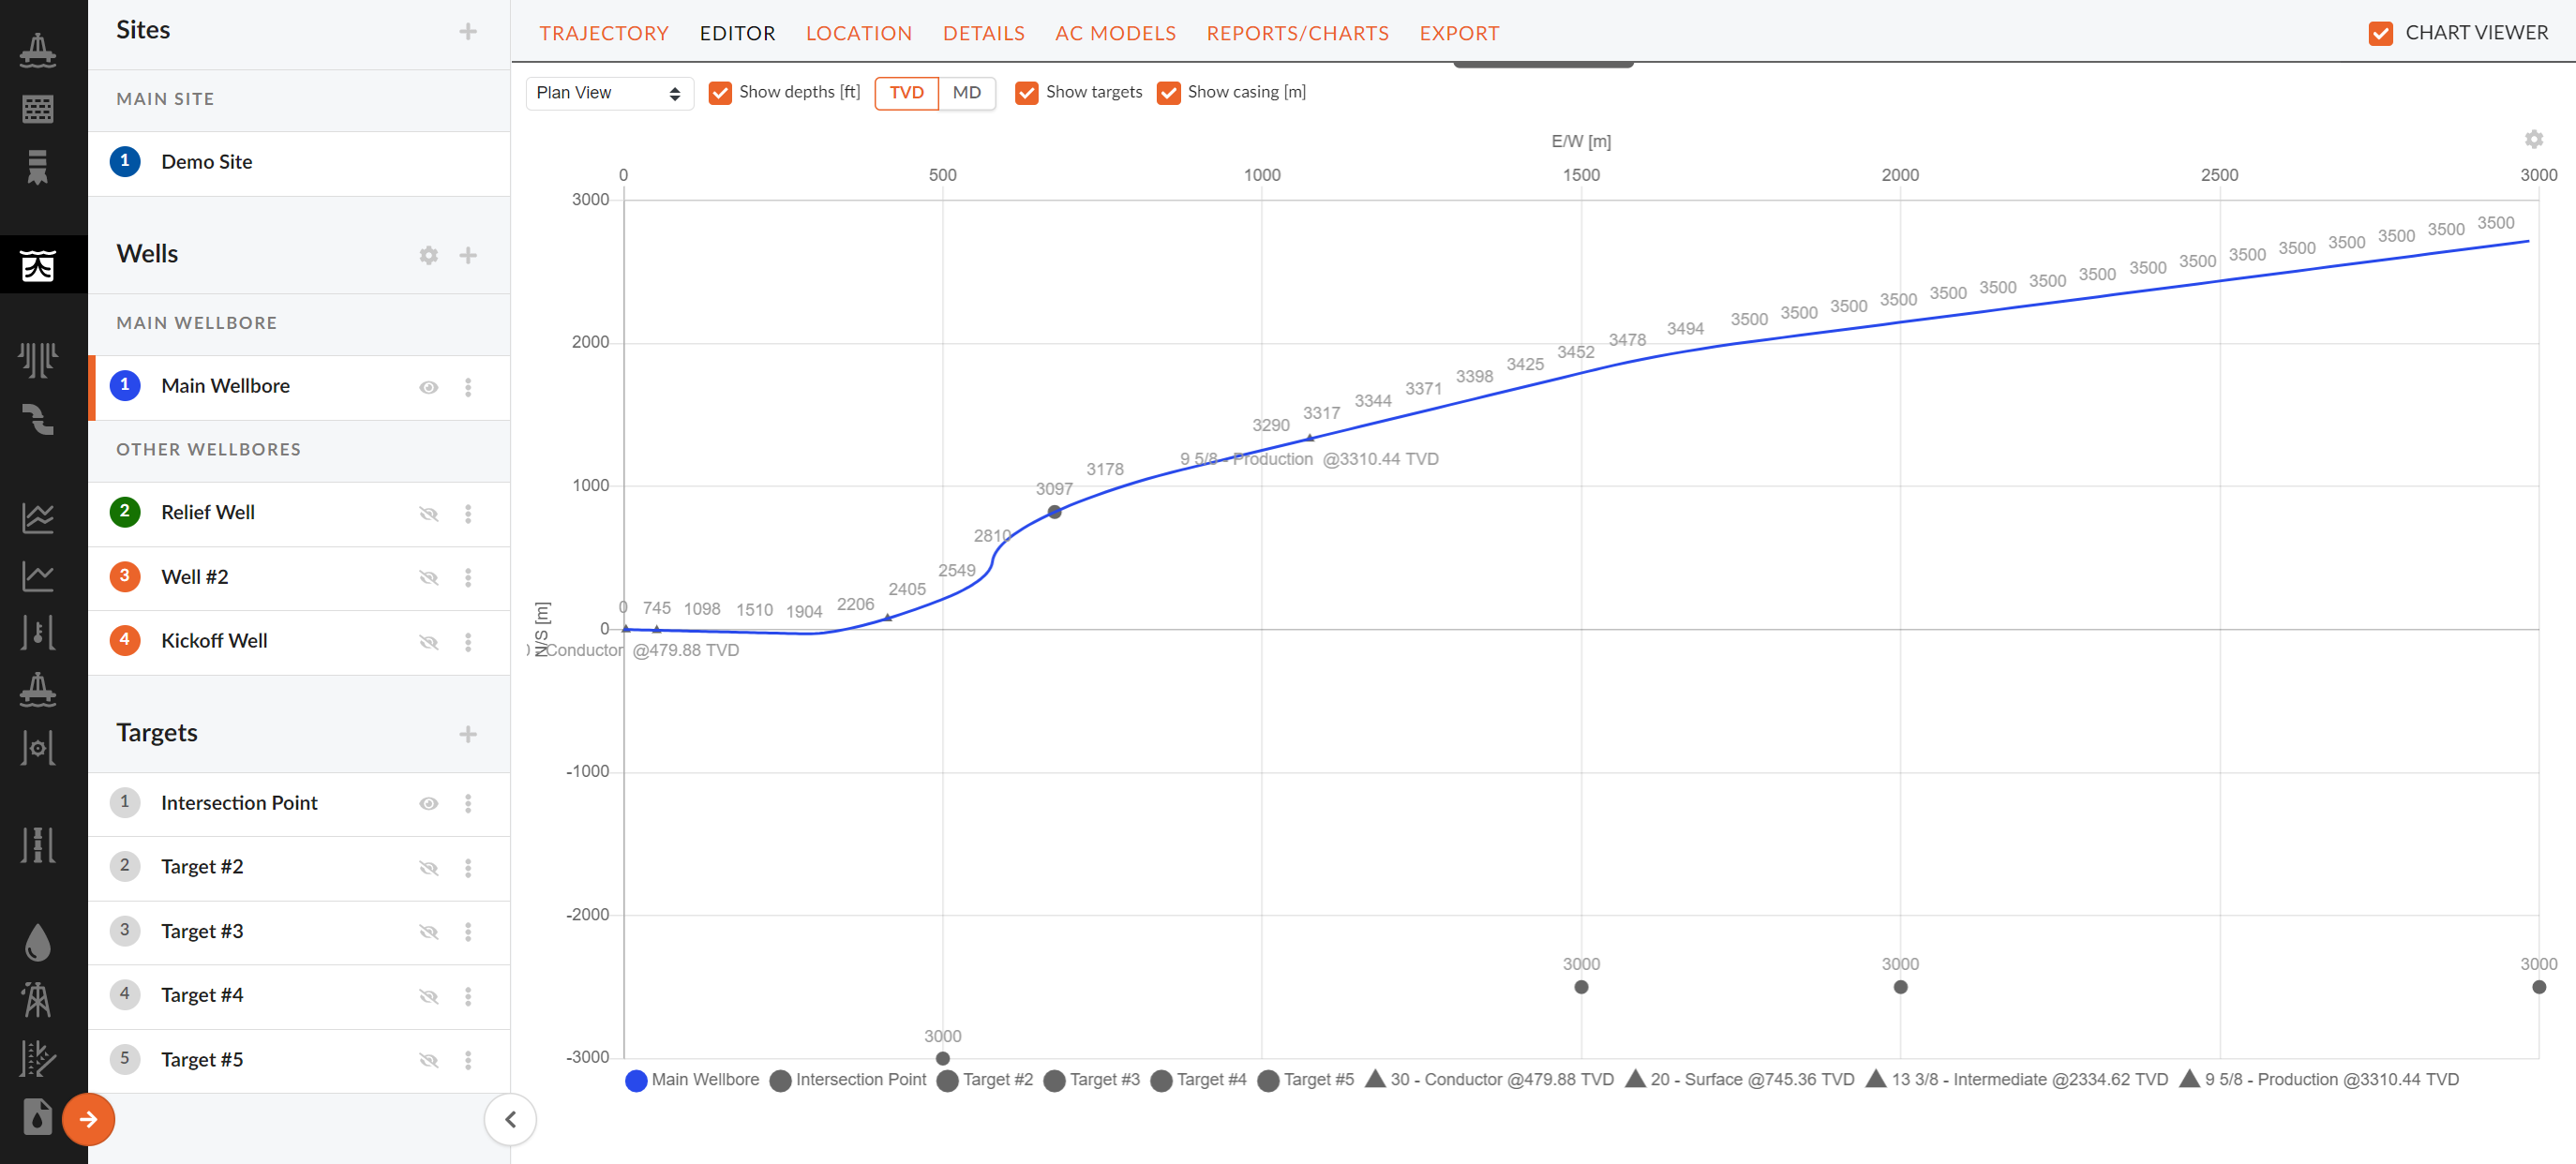
Plan View
The plan view plot shows projections of wells in the horizontal plane. To access the plan view plot select "Plan View" from the drop down menu inside the chart viewer.
NOTE!
The "Plan View" plot will show the selected well or all wells if no wells are selected
Options in Plan View
| Option | Description |
|---|---|
| Show Casing | If enabled, this will show the casings' starting depths. |
| Show Depths | If show depths is enabled the TVD depths of the well will be displayed |
| Show Targets | If enabled, this will show you the projection of all wells in the horizontal plain. |
| Hide Wells | Select/disable wells by clicking on the well name in the plot legend. |
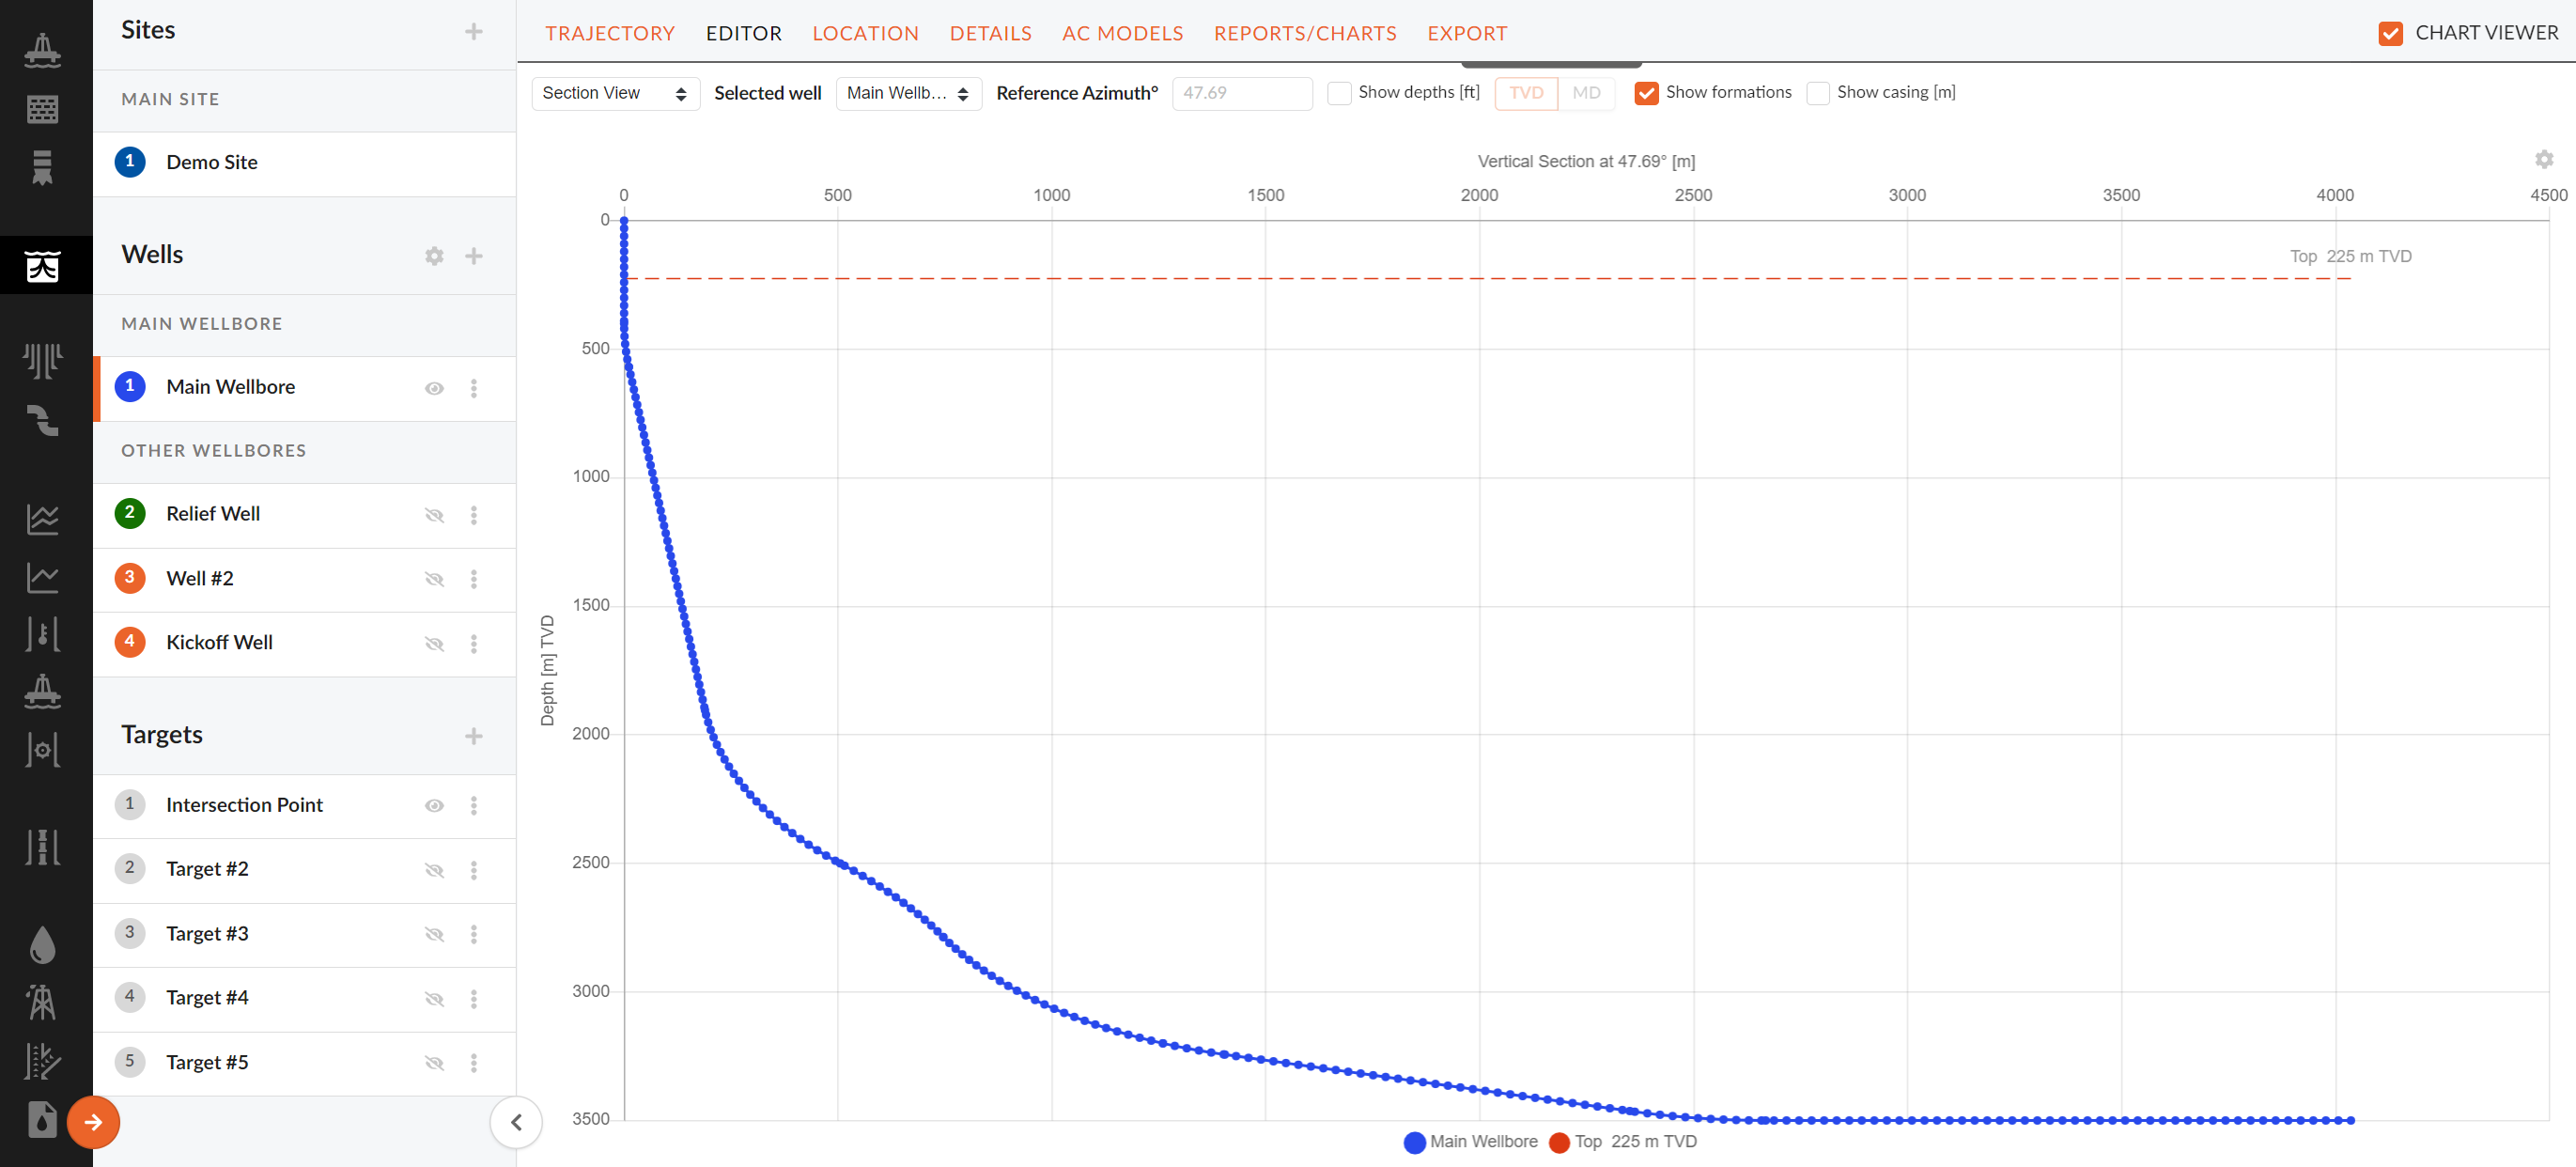
Section View
Section view plot shows the vertical section of the well projected on to a vertical plain. The azimuth of the vertical plane is calculated by default. The casing, depth, and formation can be shown on the plot by enabling them.
NOTE!
The reference azimuth of the vertical plan can be manually overridden by inputting a desired reference azimuth in the top of the plot.
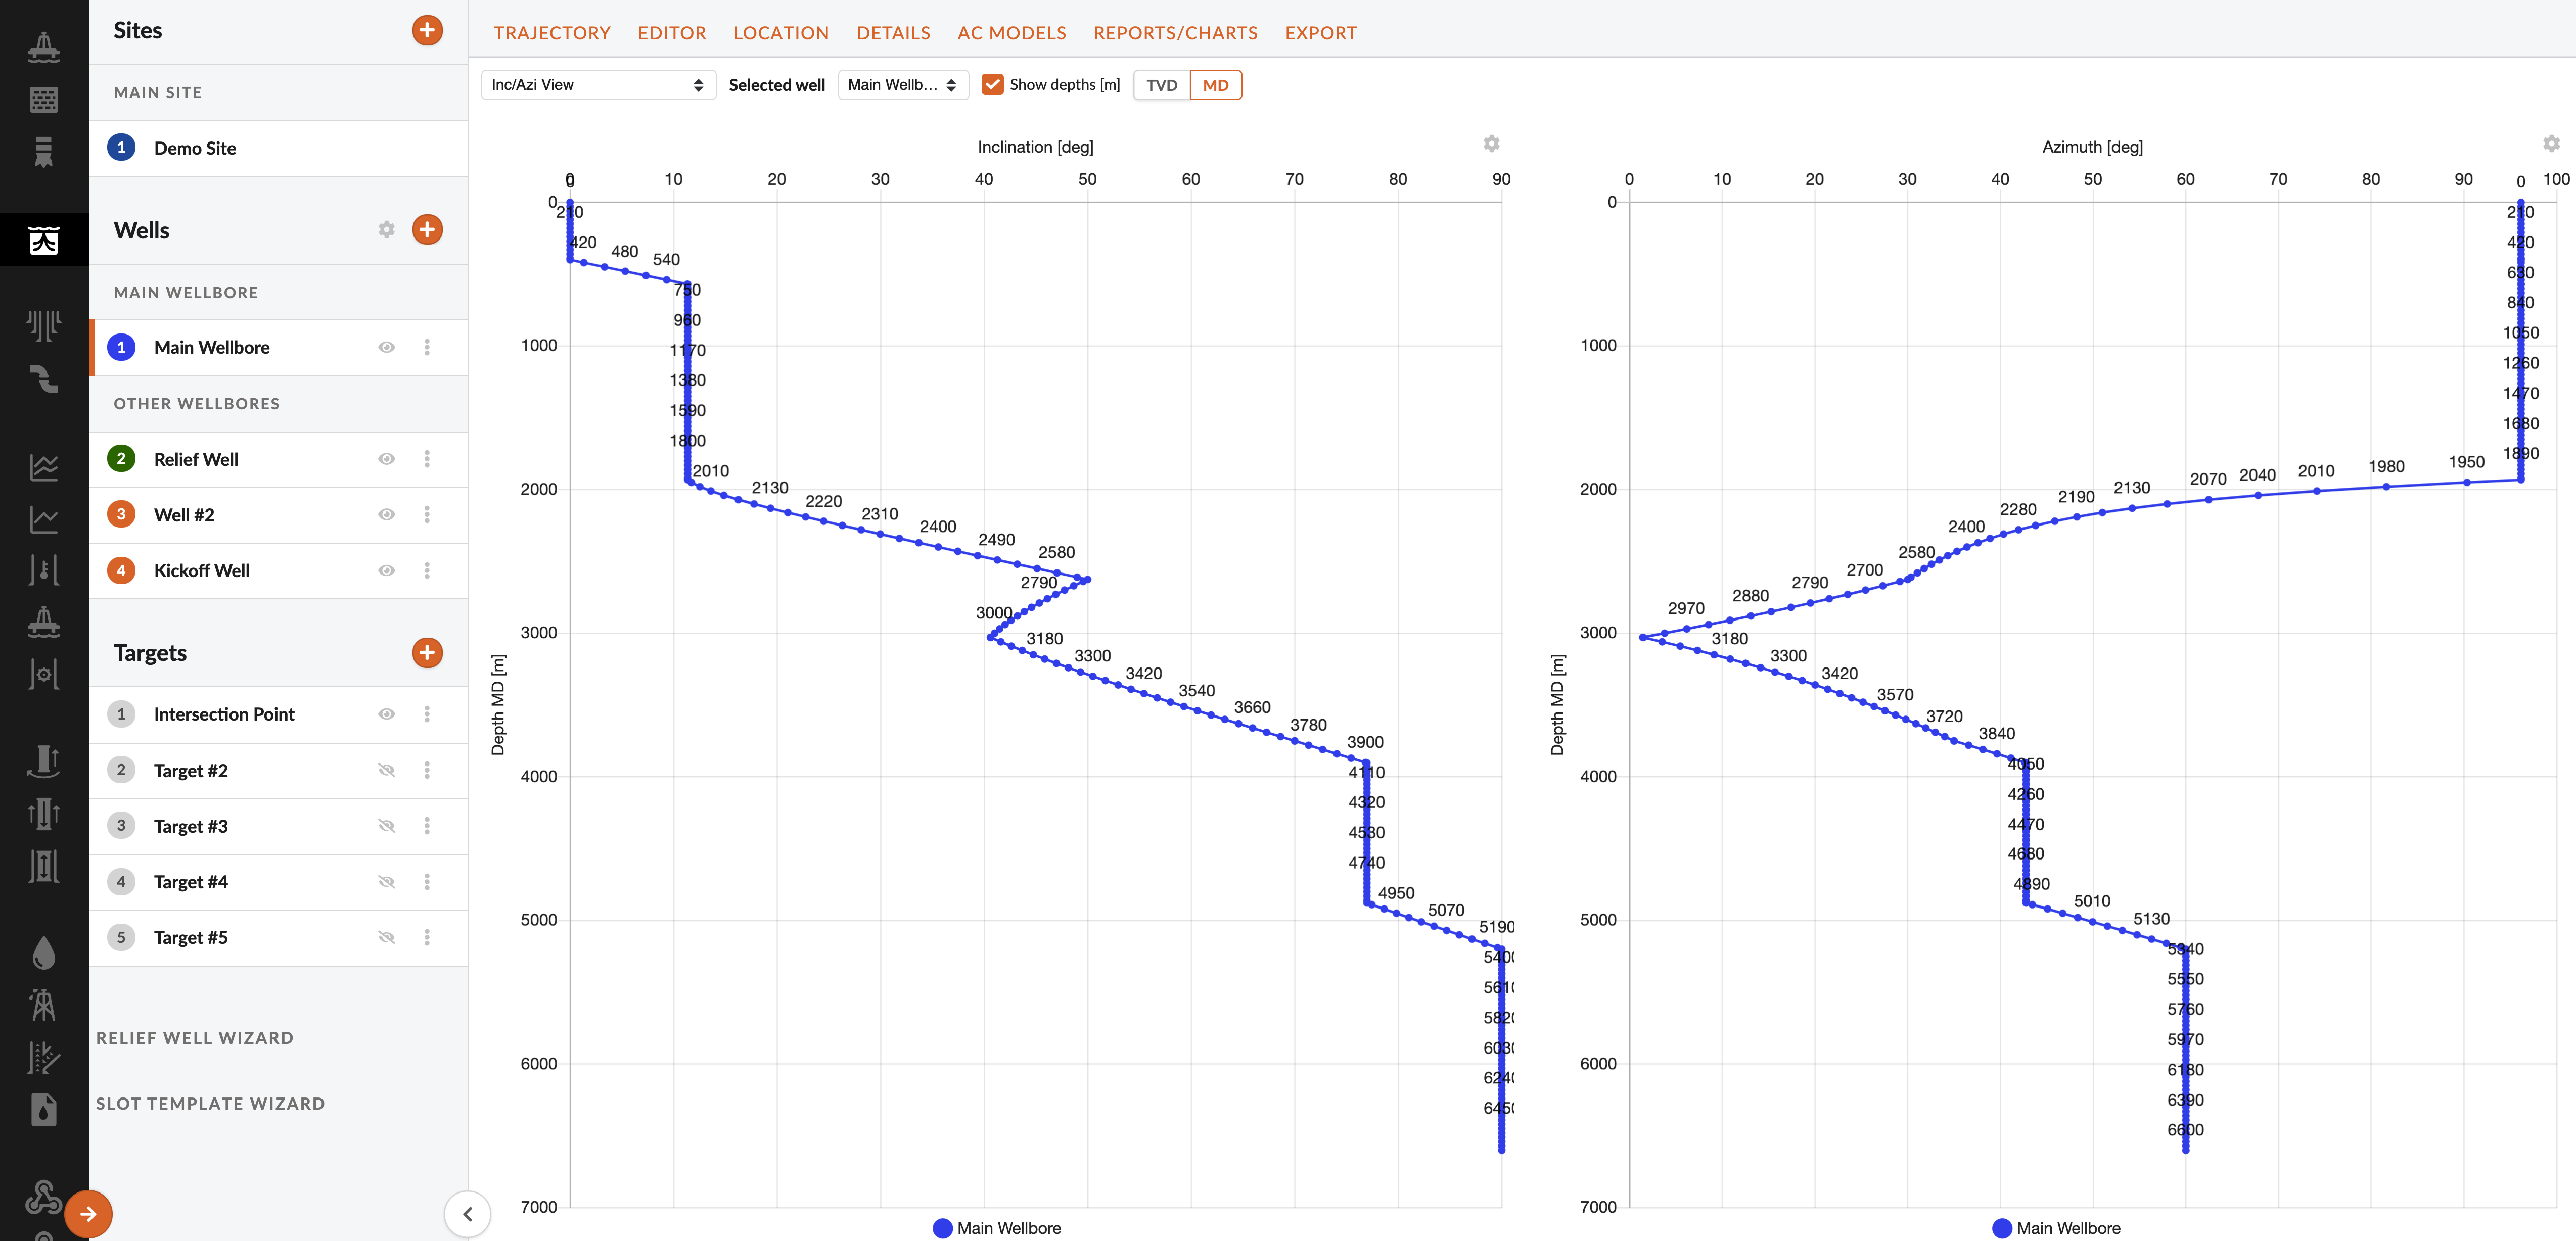
Inc/Azi View
Inc/Azi View shows two plots of inclination and azimuth vs measured depth respectively. Depth labels can be toggled where both TVD and MD options are available.