Torque & Drag
NOTE!
The minimum required information to perform a T&D analysis is to define a drill string and drilling fluid. To see how to define a drill string and drilling fluid click here.To read about simulation settings in T&D press here.
Input for Torque & Drag Modes
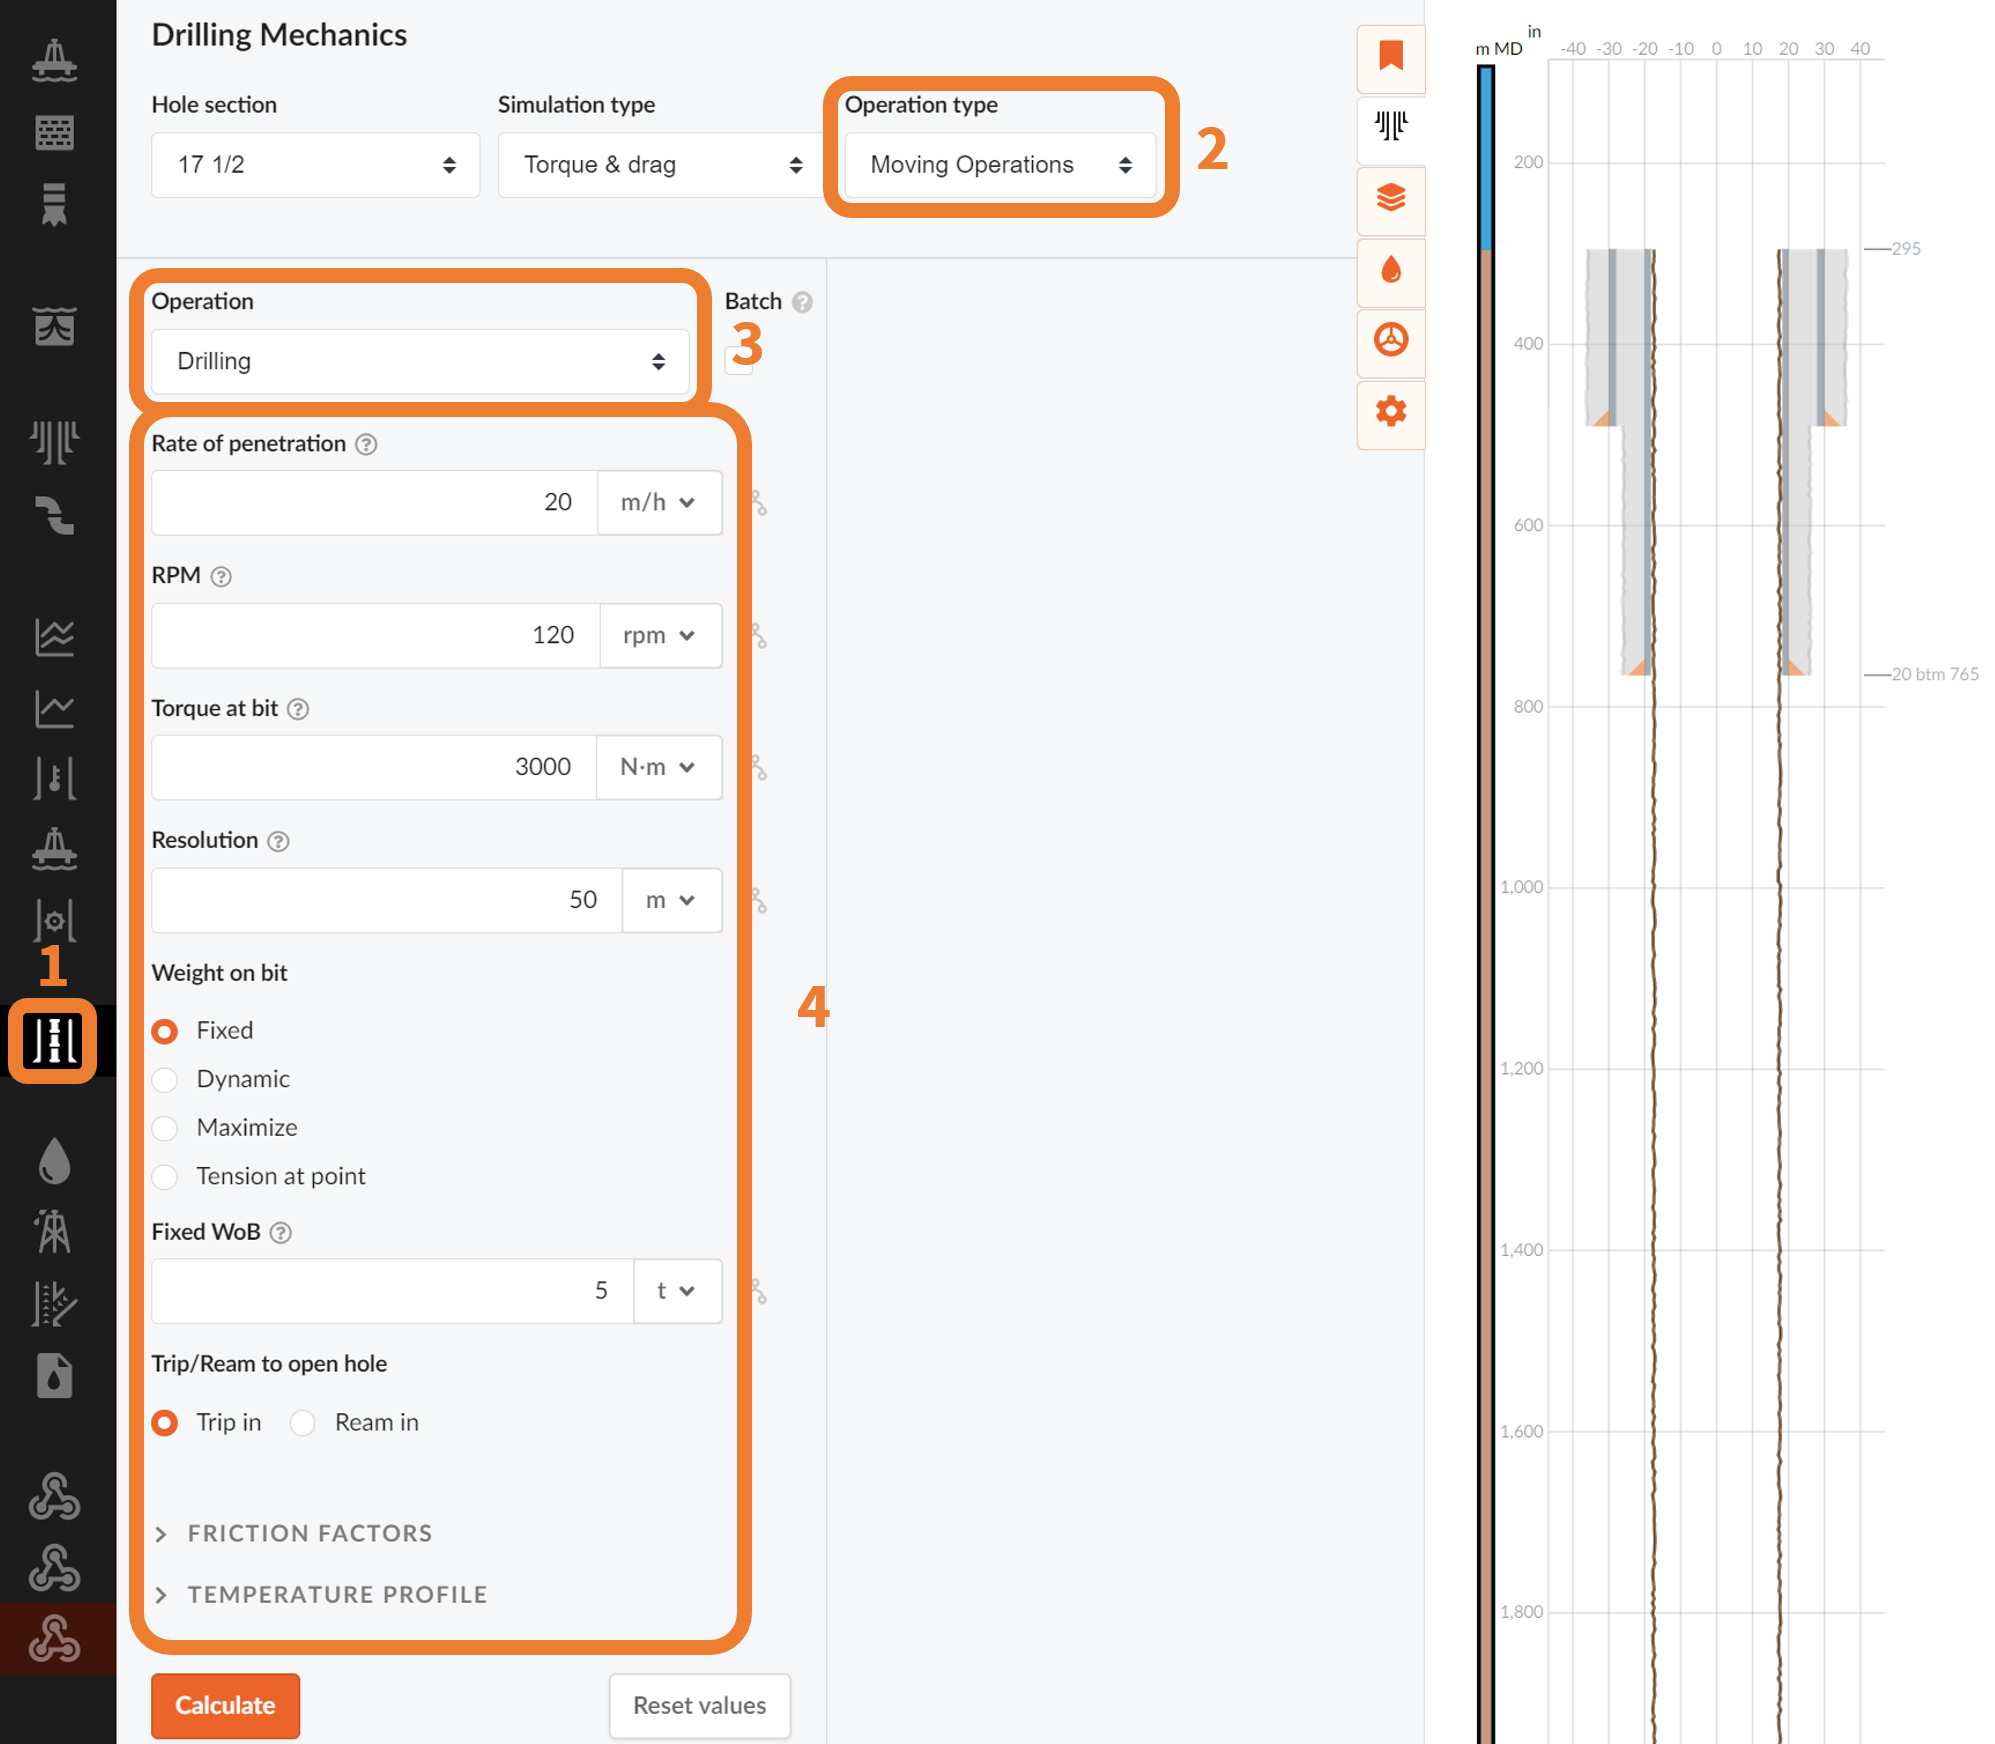
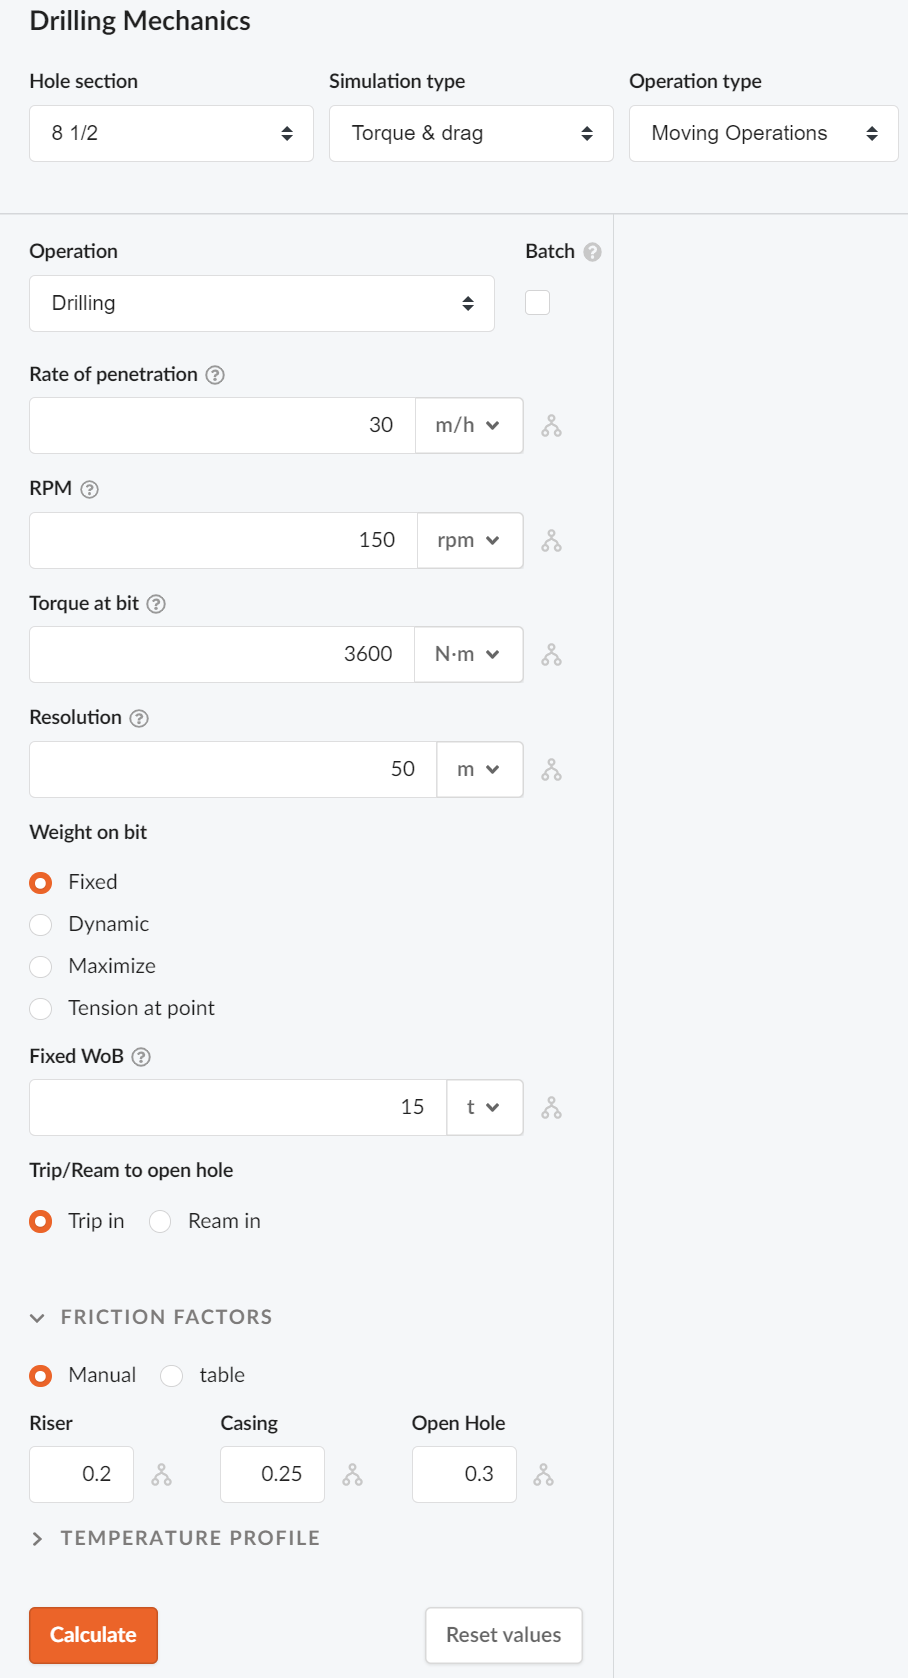
In the Torque & drag module you can chose different operations/modes that you wish to simulate. Under “Operation Type” (2) you can choose between static and moving operations by using the drop-down menu. Both modes have different operations chosen under "Operation" (3). These operations have a set of different input parameters (4) that have to be filled in.
Define your Friction Factors
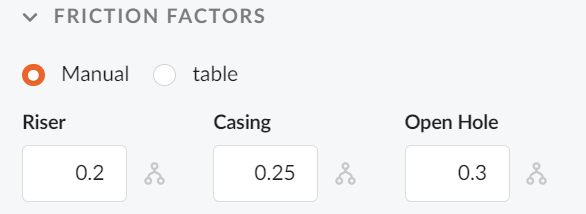
Friction factors can be input as constants for riser, casing and open hole or in a table with free depth interval input.
In the Manual input mode, the friction factors are defined with respect to the type of material. Three factors are assigned to Riser, Casing and Open Hole respectively.
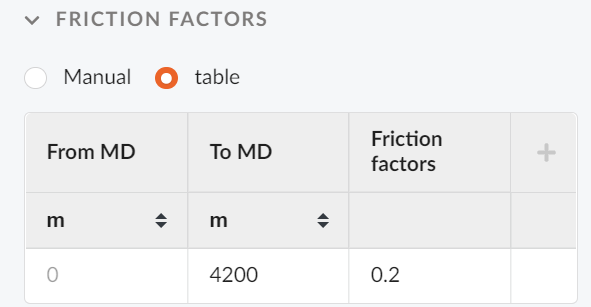
In the Table input mode, the friction factors are defined based on depth sections.
Multiple Fluids for Static and Non-Circulating Operations
Check off this selection if you wish to run simulation with multiple fluids in the hole. (Fluid train) You can specify fluid intervals for different depths of the wellbore.
Drilling Modes (Weight On Bit Calculations)
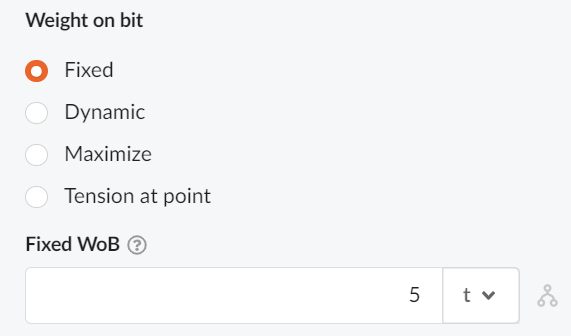
Weight on bit can be defined in four different ways; Fixed, Dynamic, Maximize or Tension Point.
Fixed
Fixed mode applies a fixed/constant WOB value to the simulations.
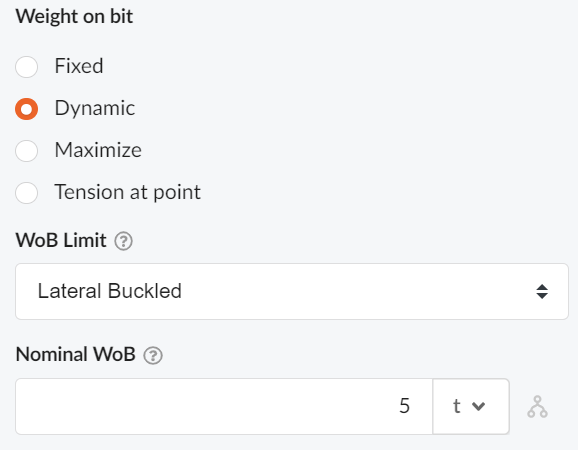
Dynamic
Dynamic weight on bit takes in a nominal WOB and gives a dynamic WOB below this value to stay out of chosen buckling mode.
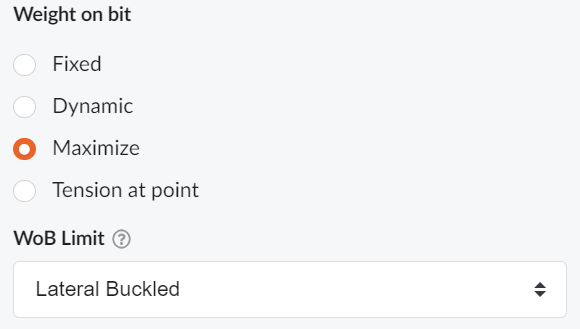
Maximize
Maximizes the WOB to prevent chosen mode of buckling at any depth during the operation.
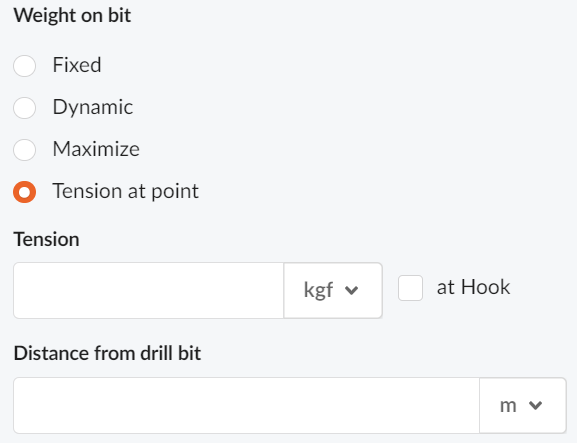
Tension Point
Tension at Point runs a simulation with a given tension at a certain distance from the drill bit.
Results
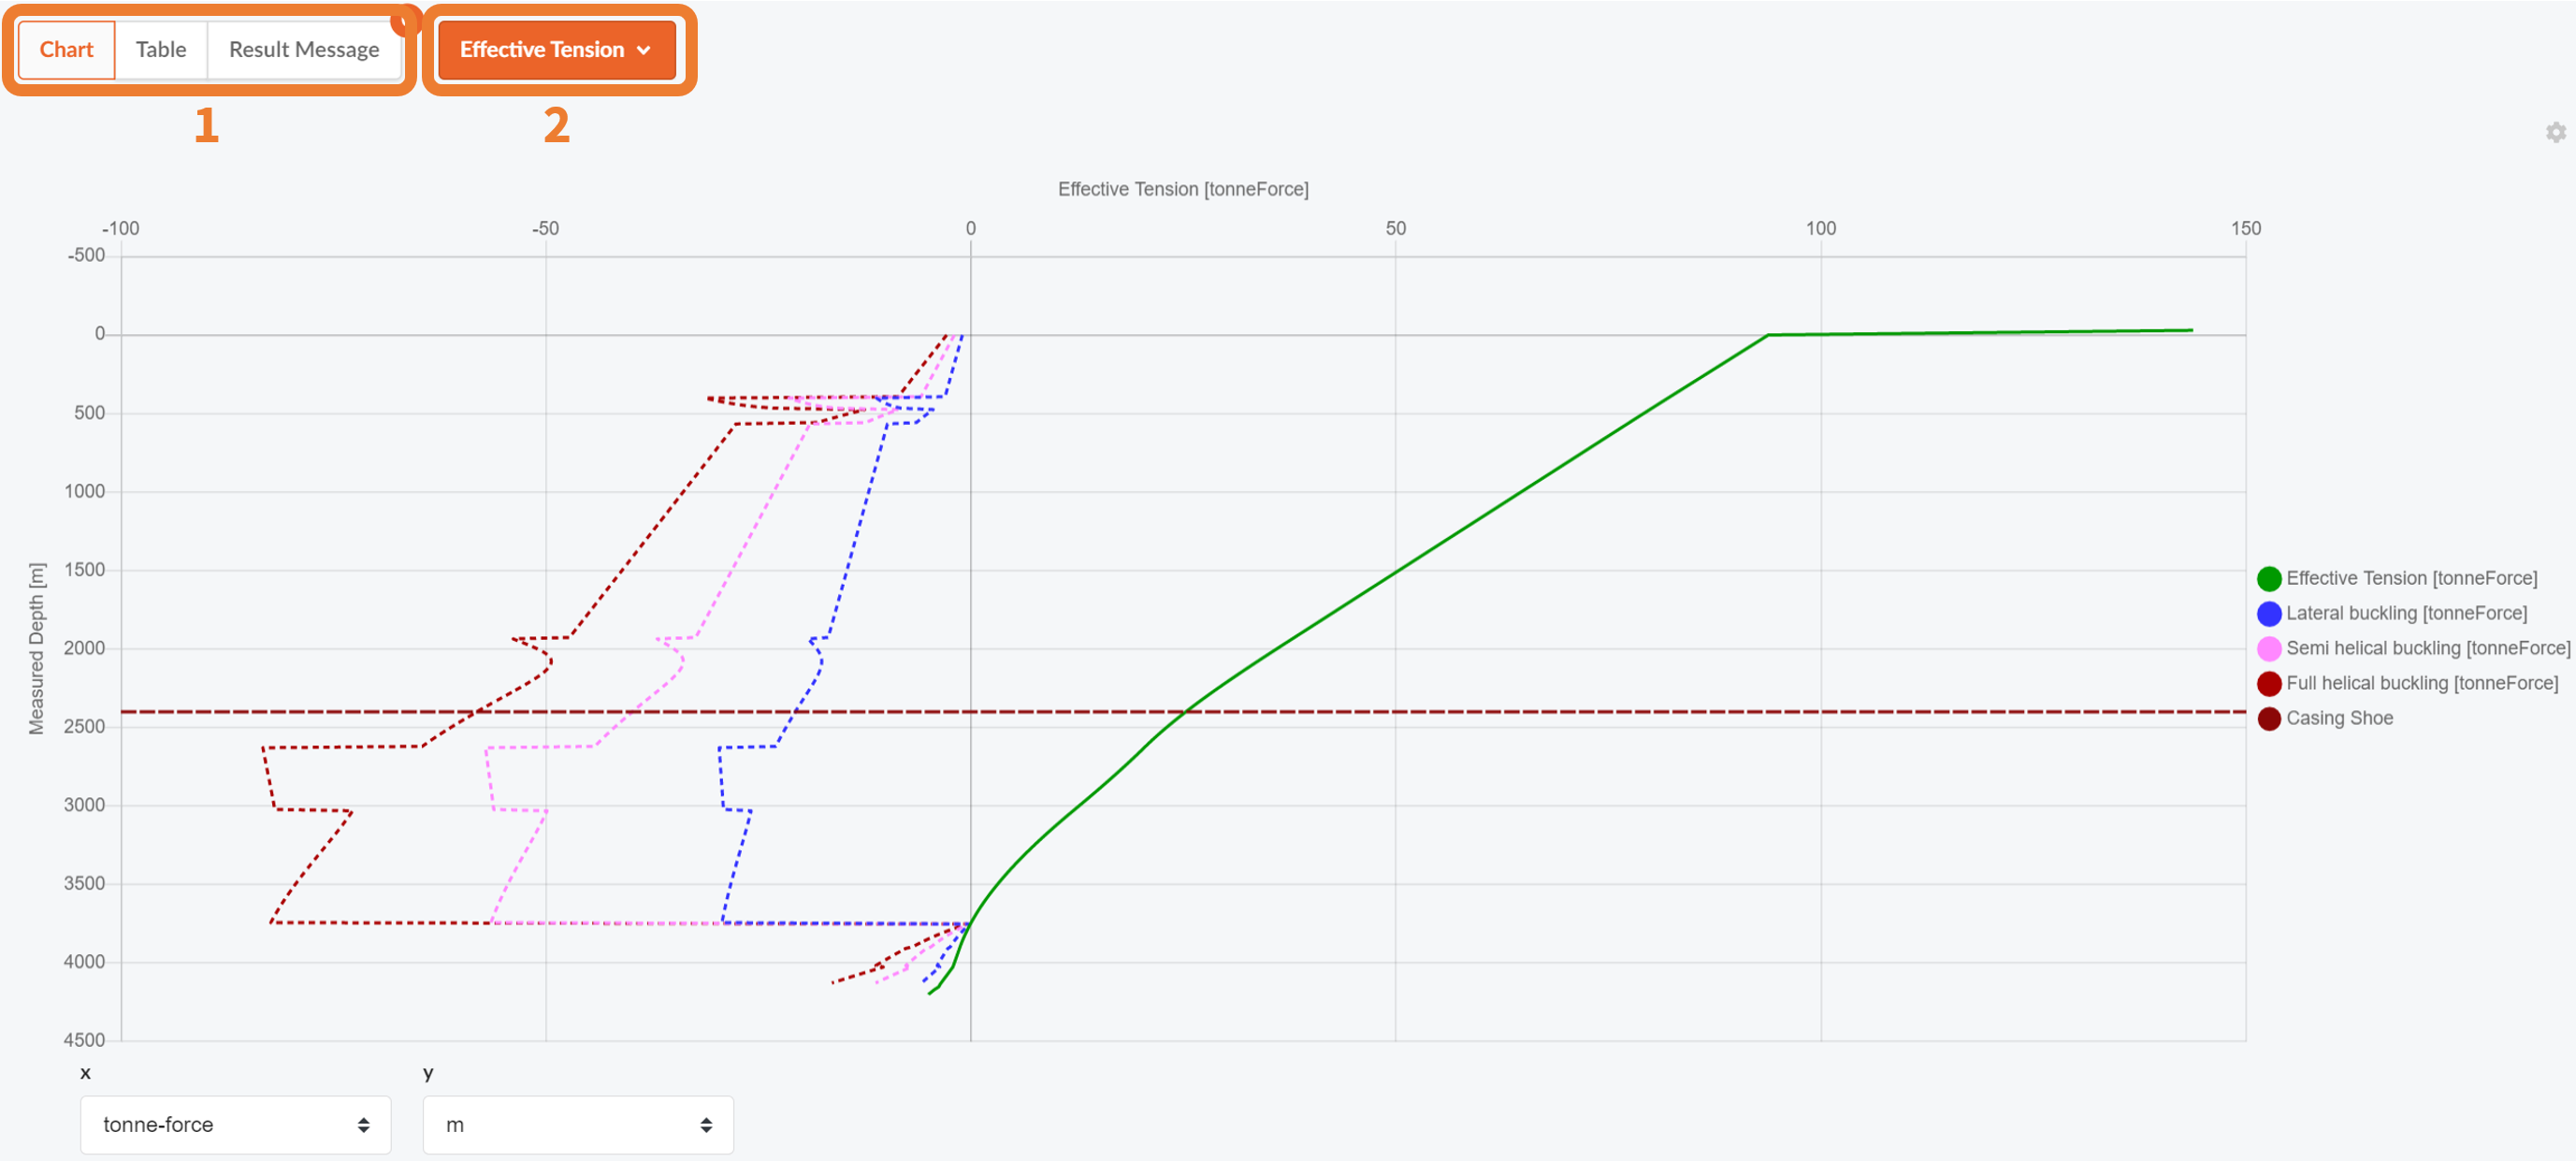
The results will be displayed on the right side of the page. You can chose which results you want to be displayed by choosing a "plot type" from the dropdown menu (2) in the figure below. All result plots can either be displayed as a plot or in a table of results by changing the tab to the left (1).
NOTE!
Results in table format can easily be exported by pressing the cog in the top right corner of the table.
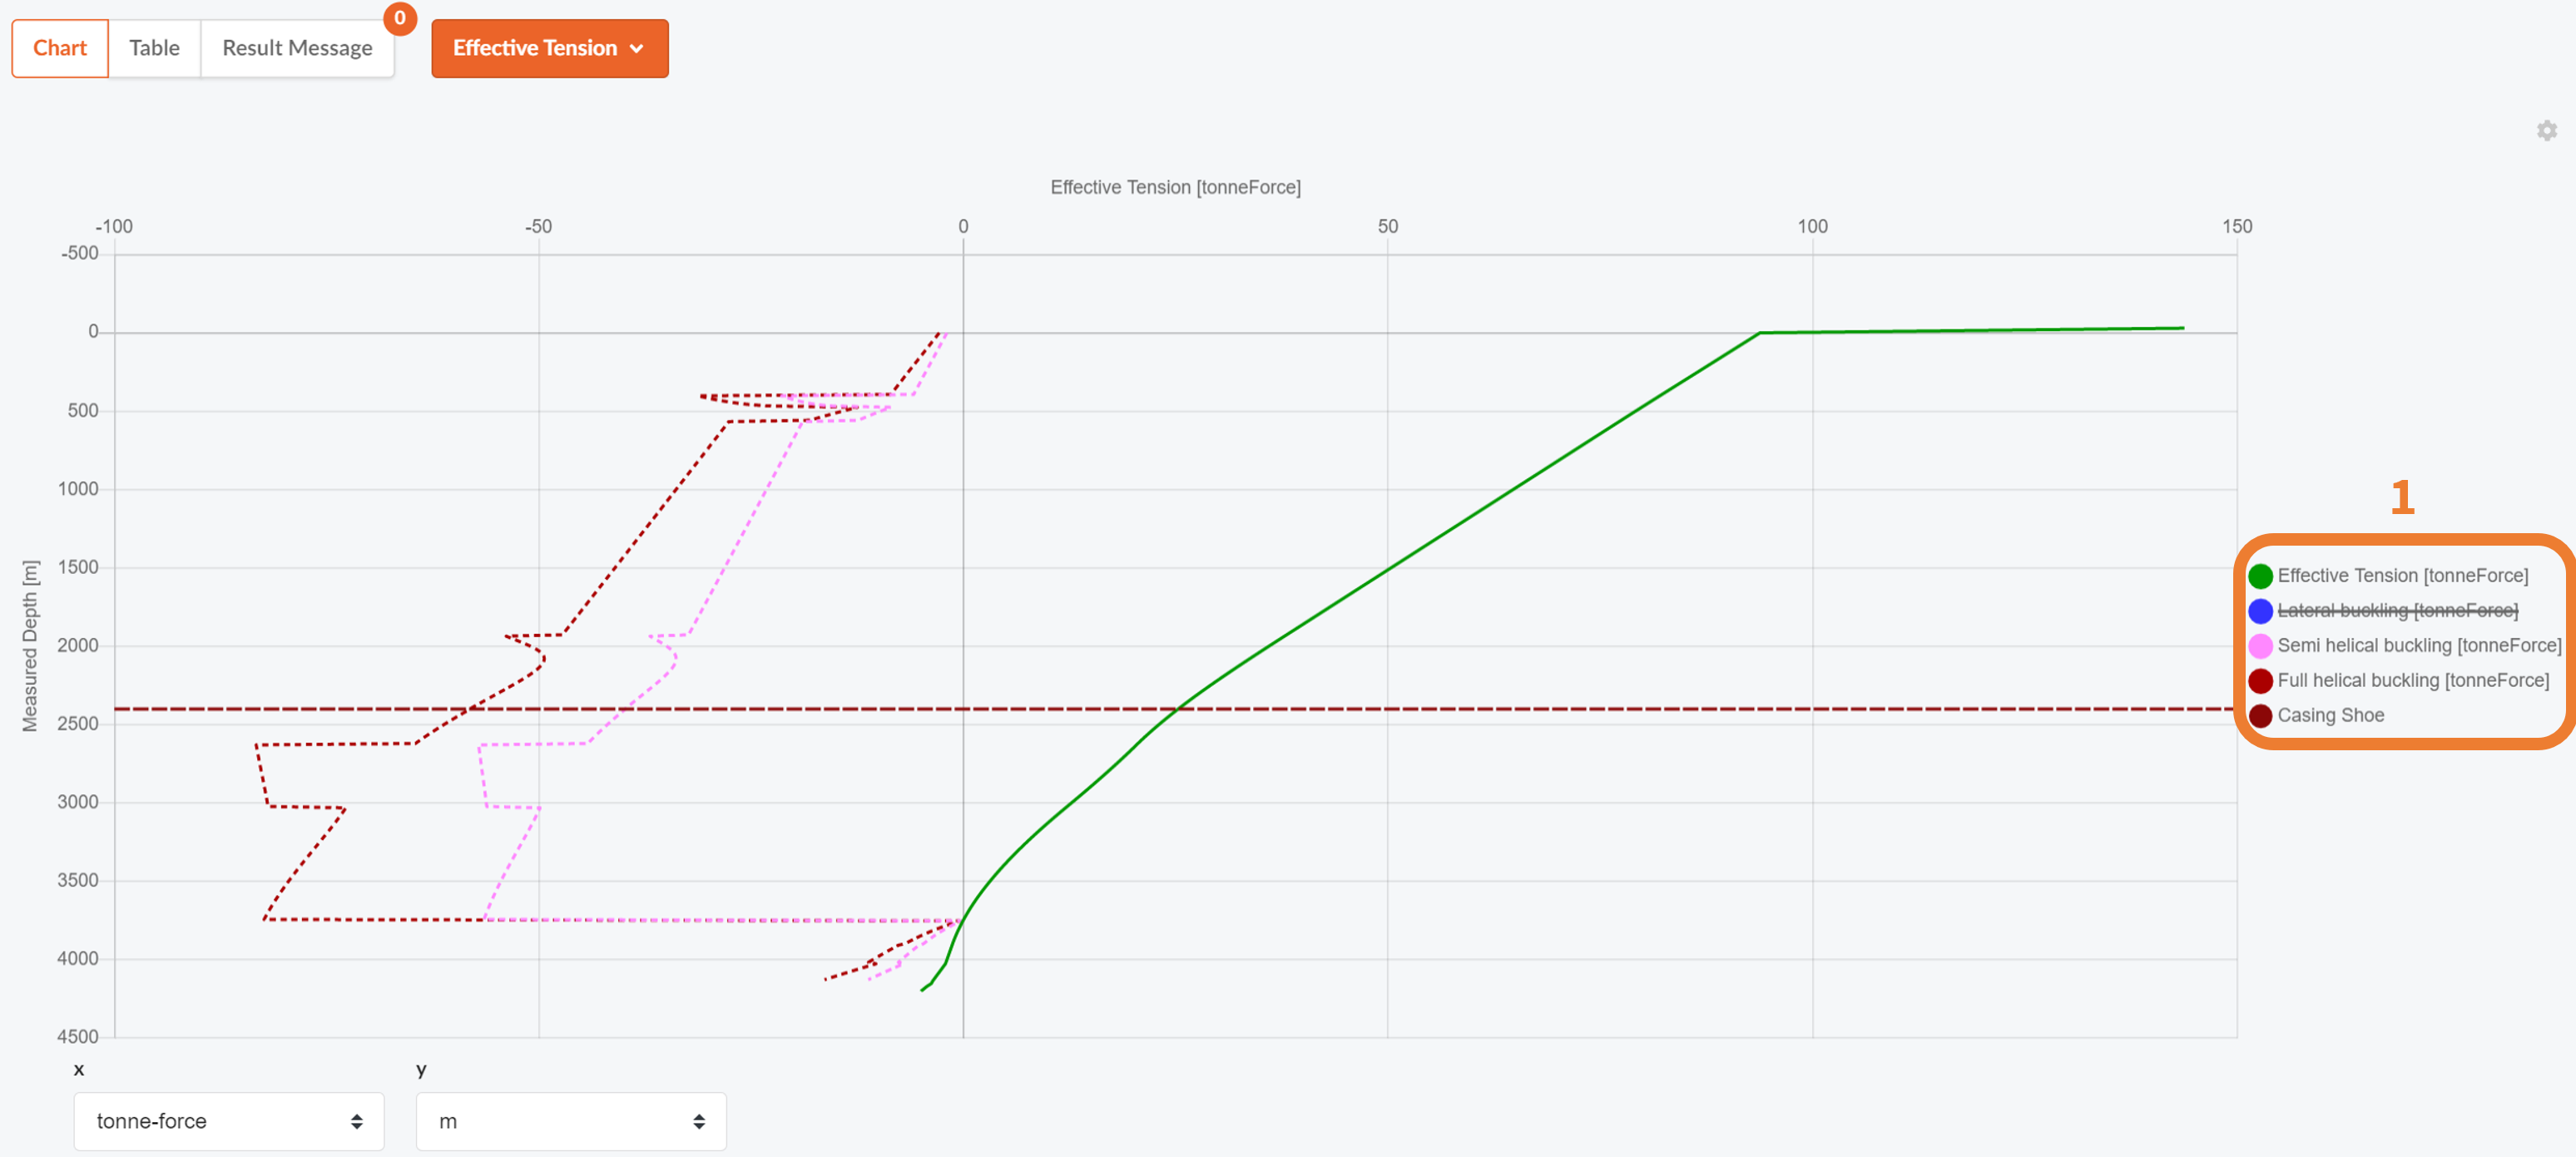
Effective Tension: The effective tension plot shows you e.g tension in the string as a function of depth (MD). To chose what to plot in the effective tension plot section, toggle values by pressing the names (1) shown below.
NOTE!
Units can be cahnged in the table or i the bottom of the plots for all result options.
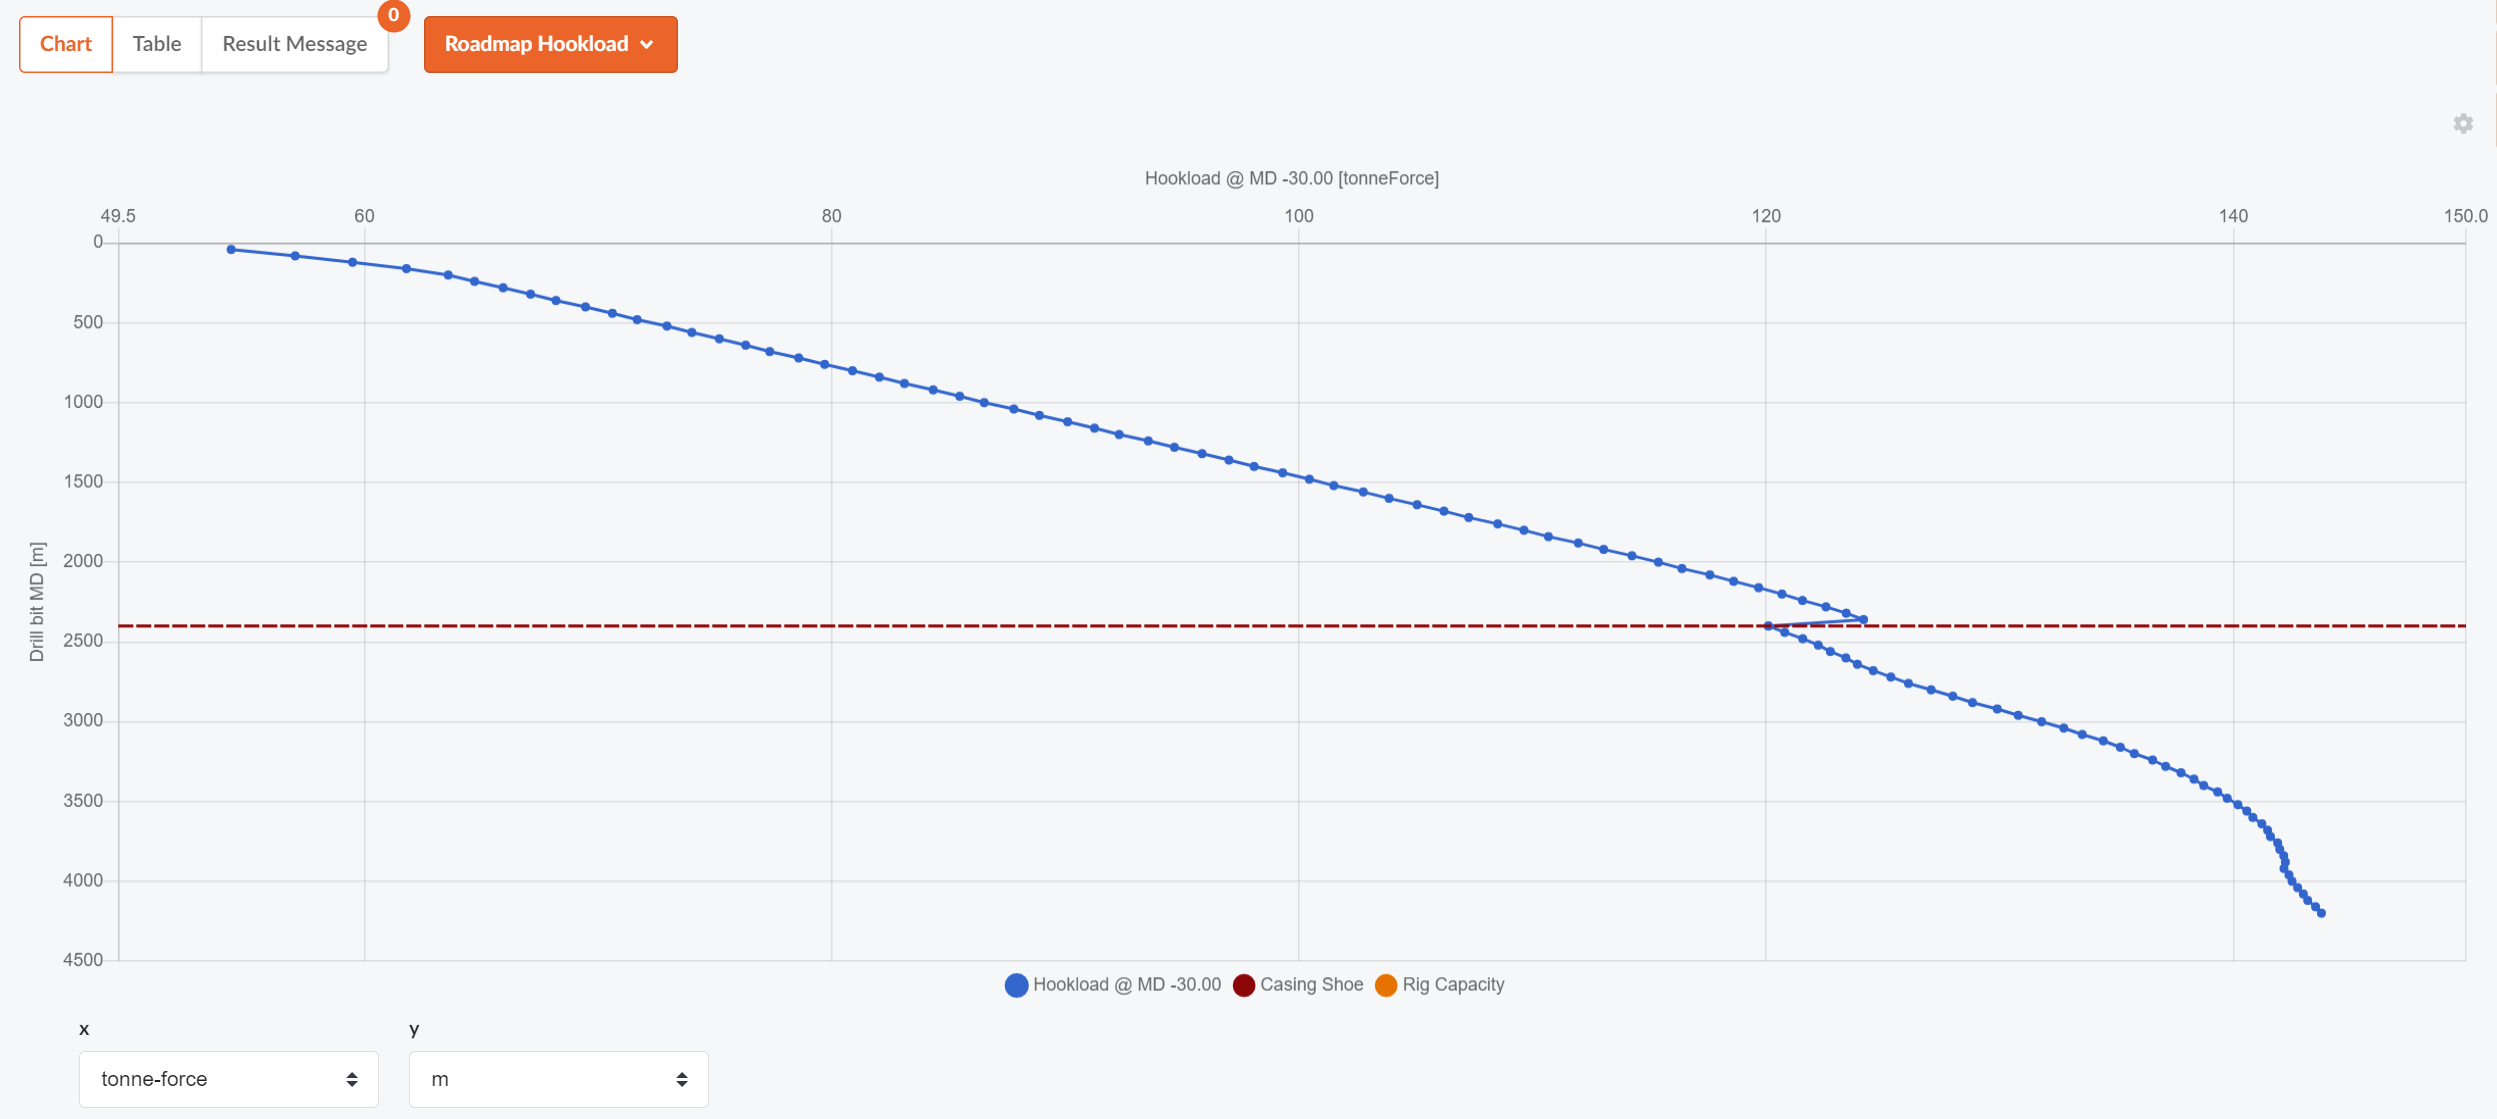
Roadmap Hookload: The hookload roadmap plot shows the weight of the drill string measured from the hook at surface. The weight can be read at any given depth at the given resolution.
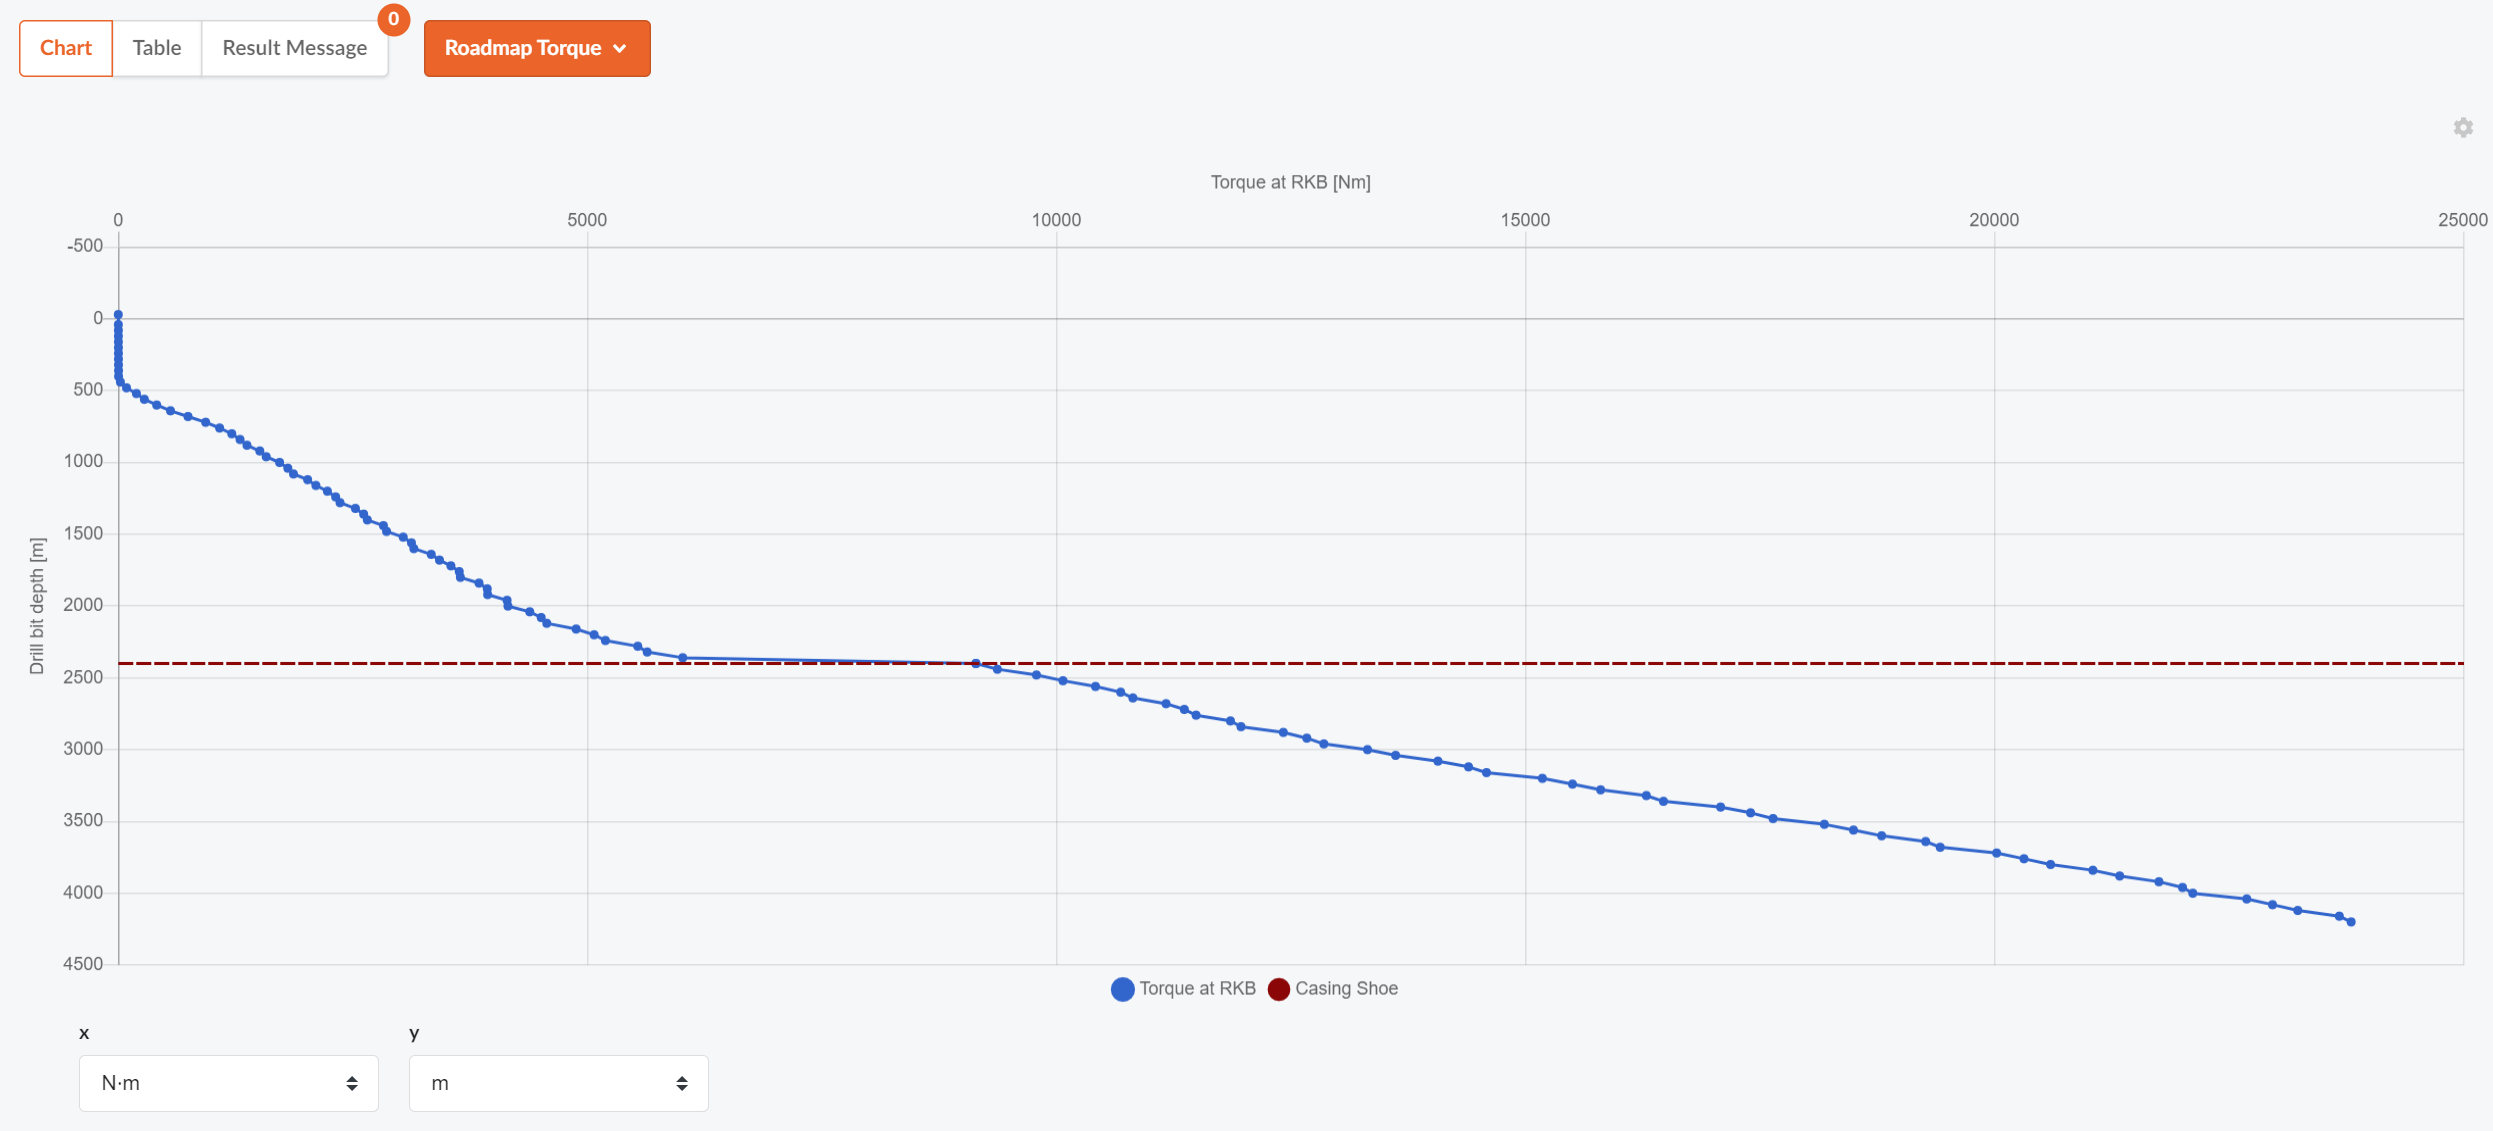
Roadmap Torque: The roadmap torque plot shows you the calculated torque on the string during rotating operations. (In non-rotating operations torque = 0)
Upload Data for Comparison (Hookload + Torque Plots)
To upload a different result set or real time data to compare with, enter the Table tab of the results.
Upload a data set from excel (paste from clipboard) or upload a file with results.
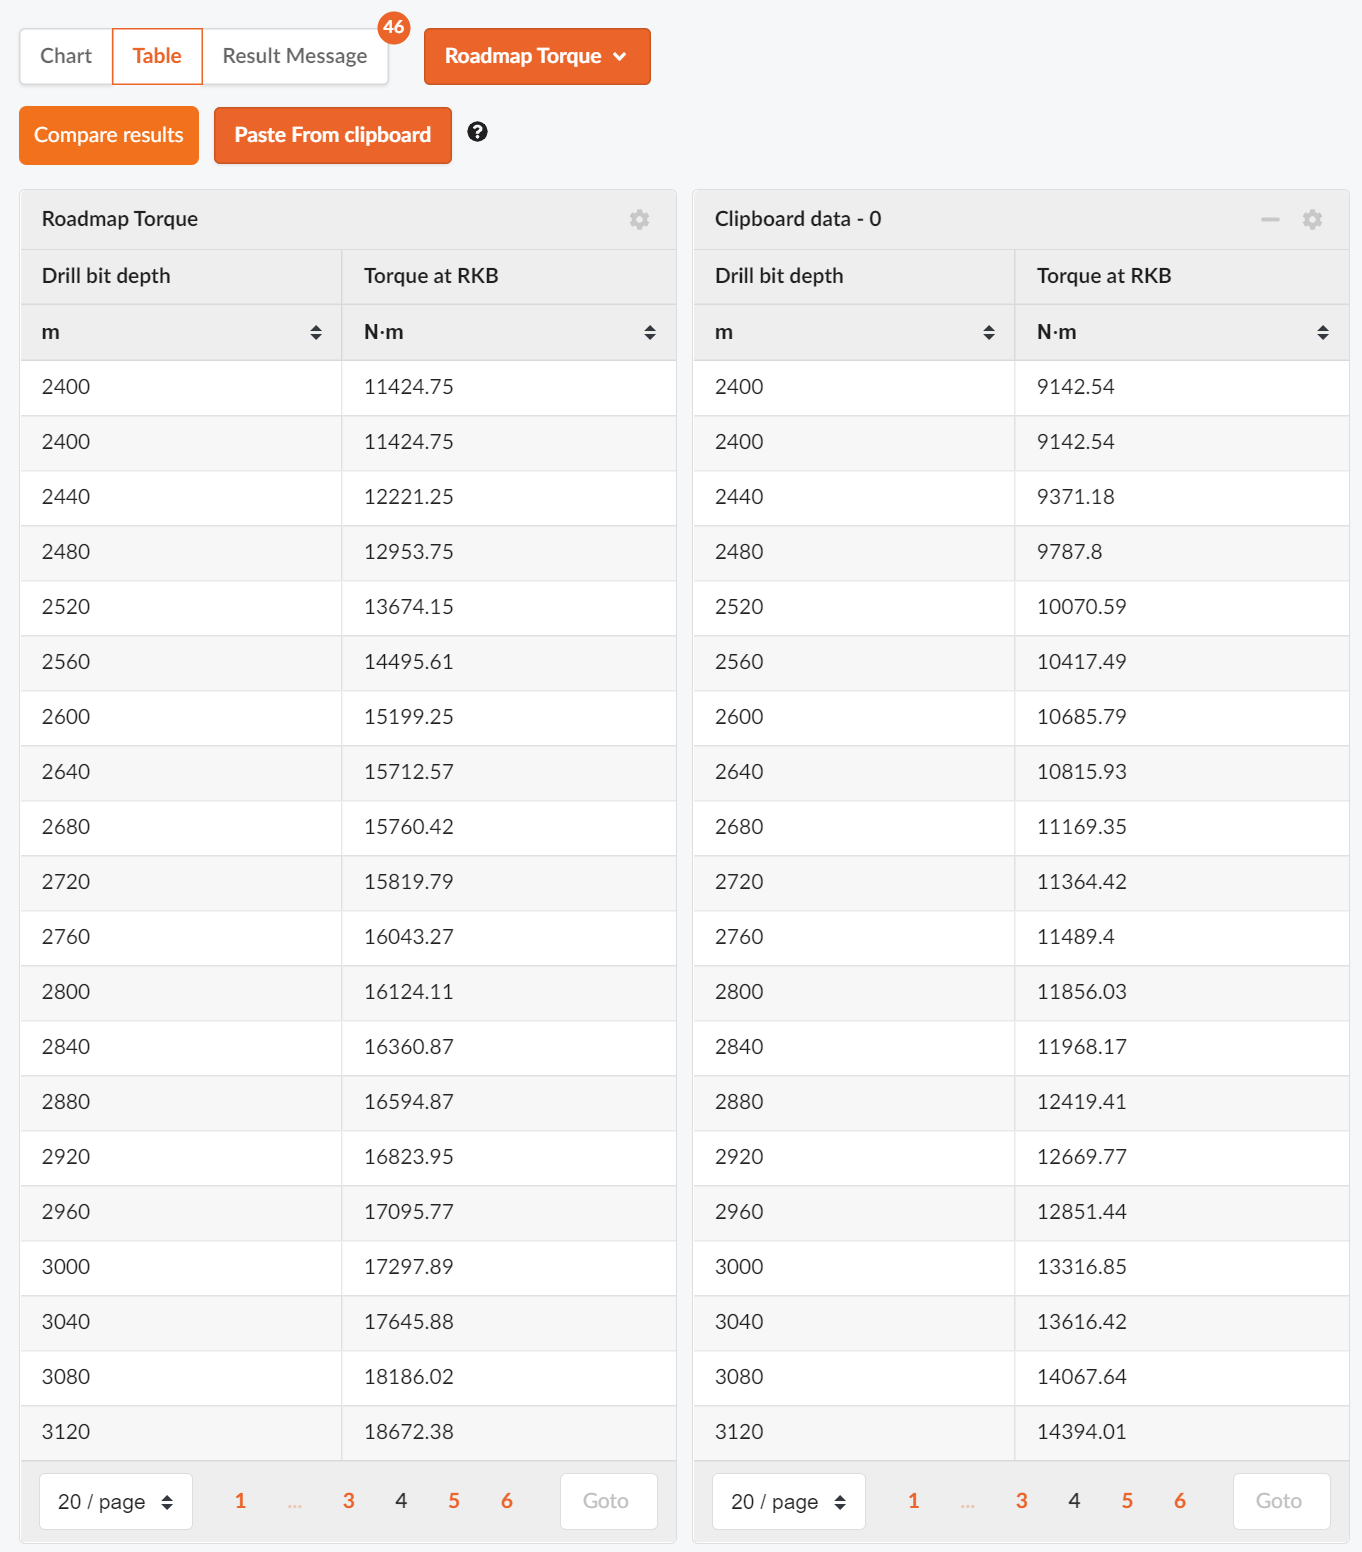
NOTE!
The data format expected are columns of numbers matching the format of the results. The application will read these numbers in the same unit that you results are shown in. E.g the picture above has results in m and Nm.
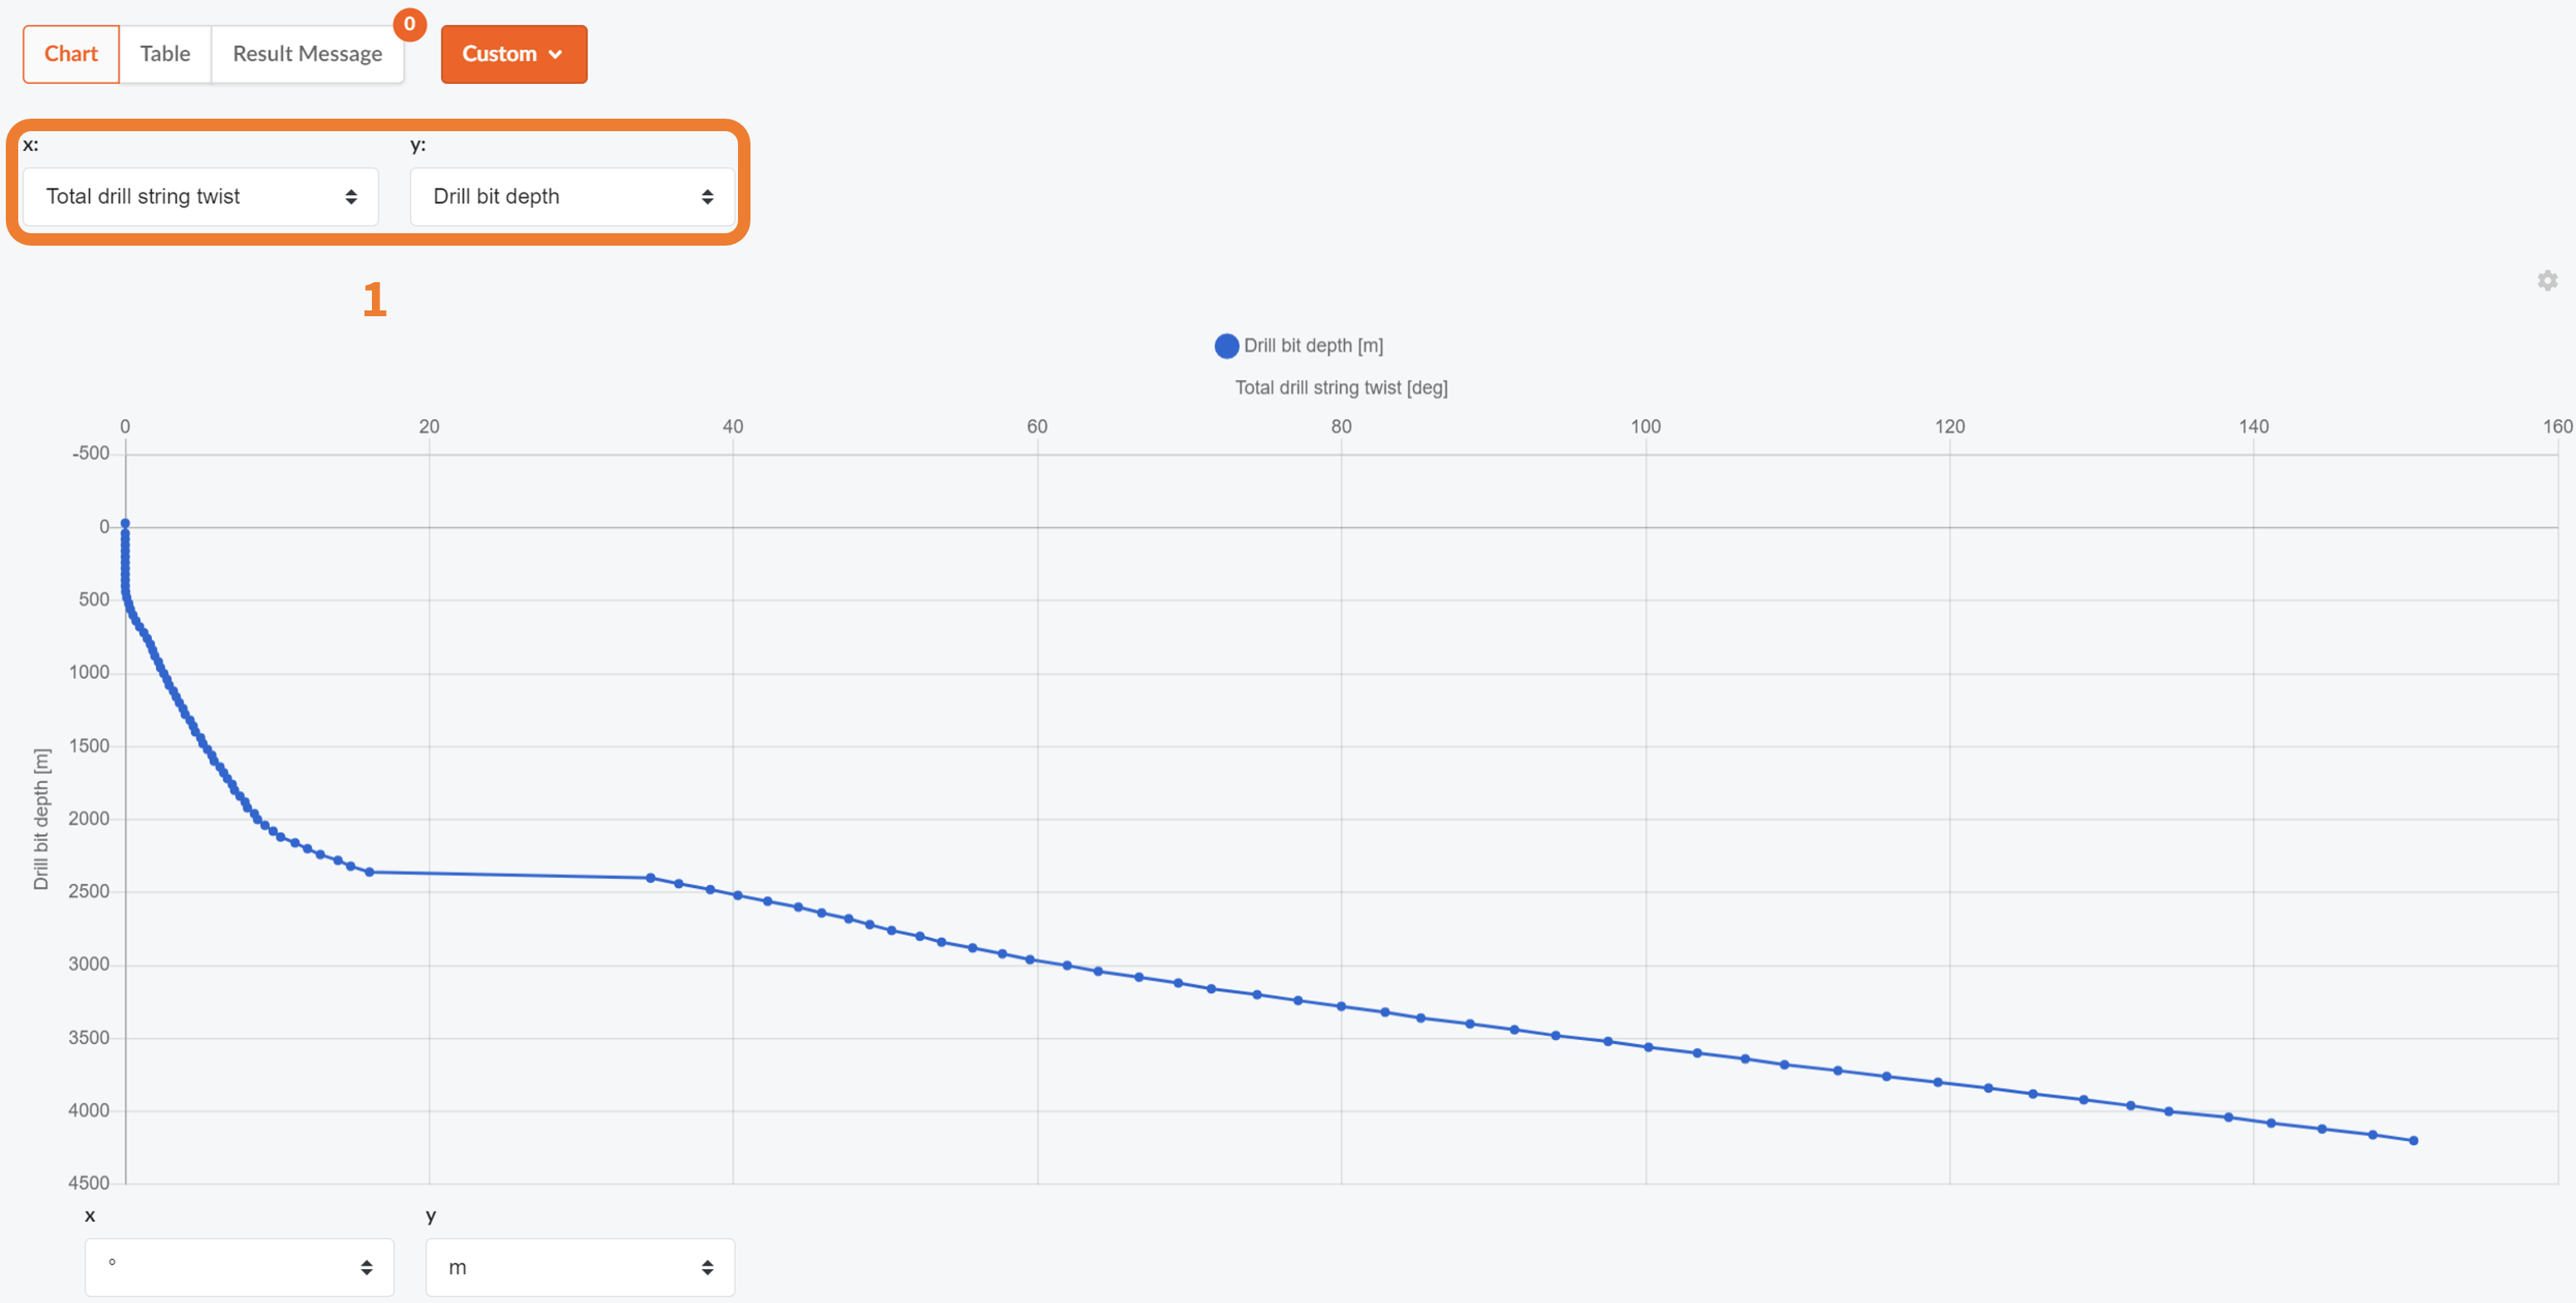
Custom: In the custom plot you can customize your own plot by selecting what you want to be displayed on your axis. The different options for each axis can be found in the drop down menues (1) shown in the figure below.
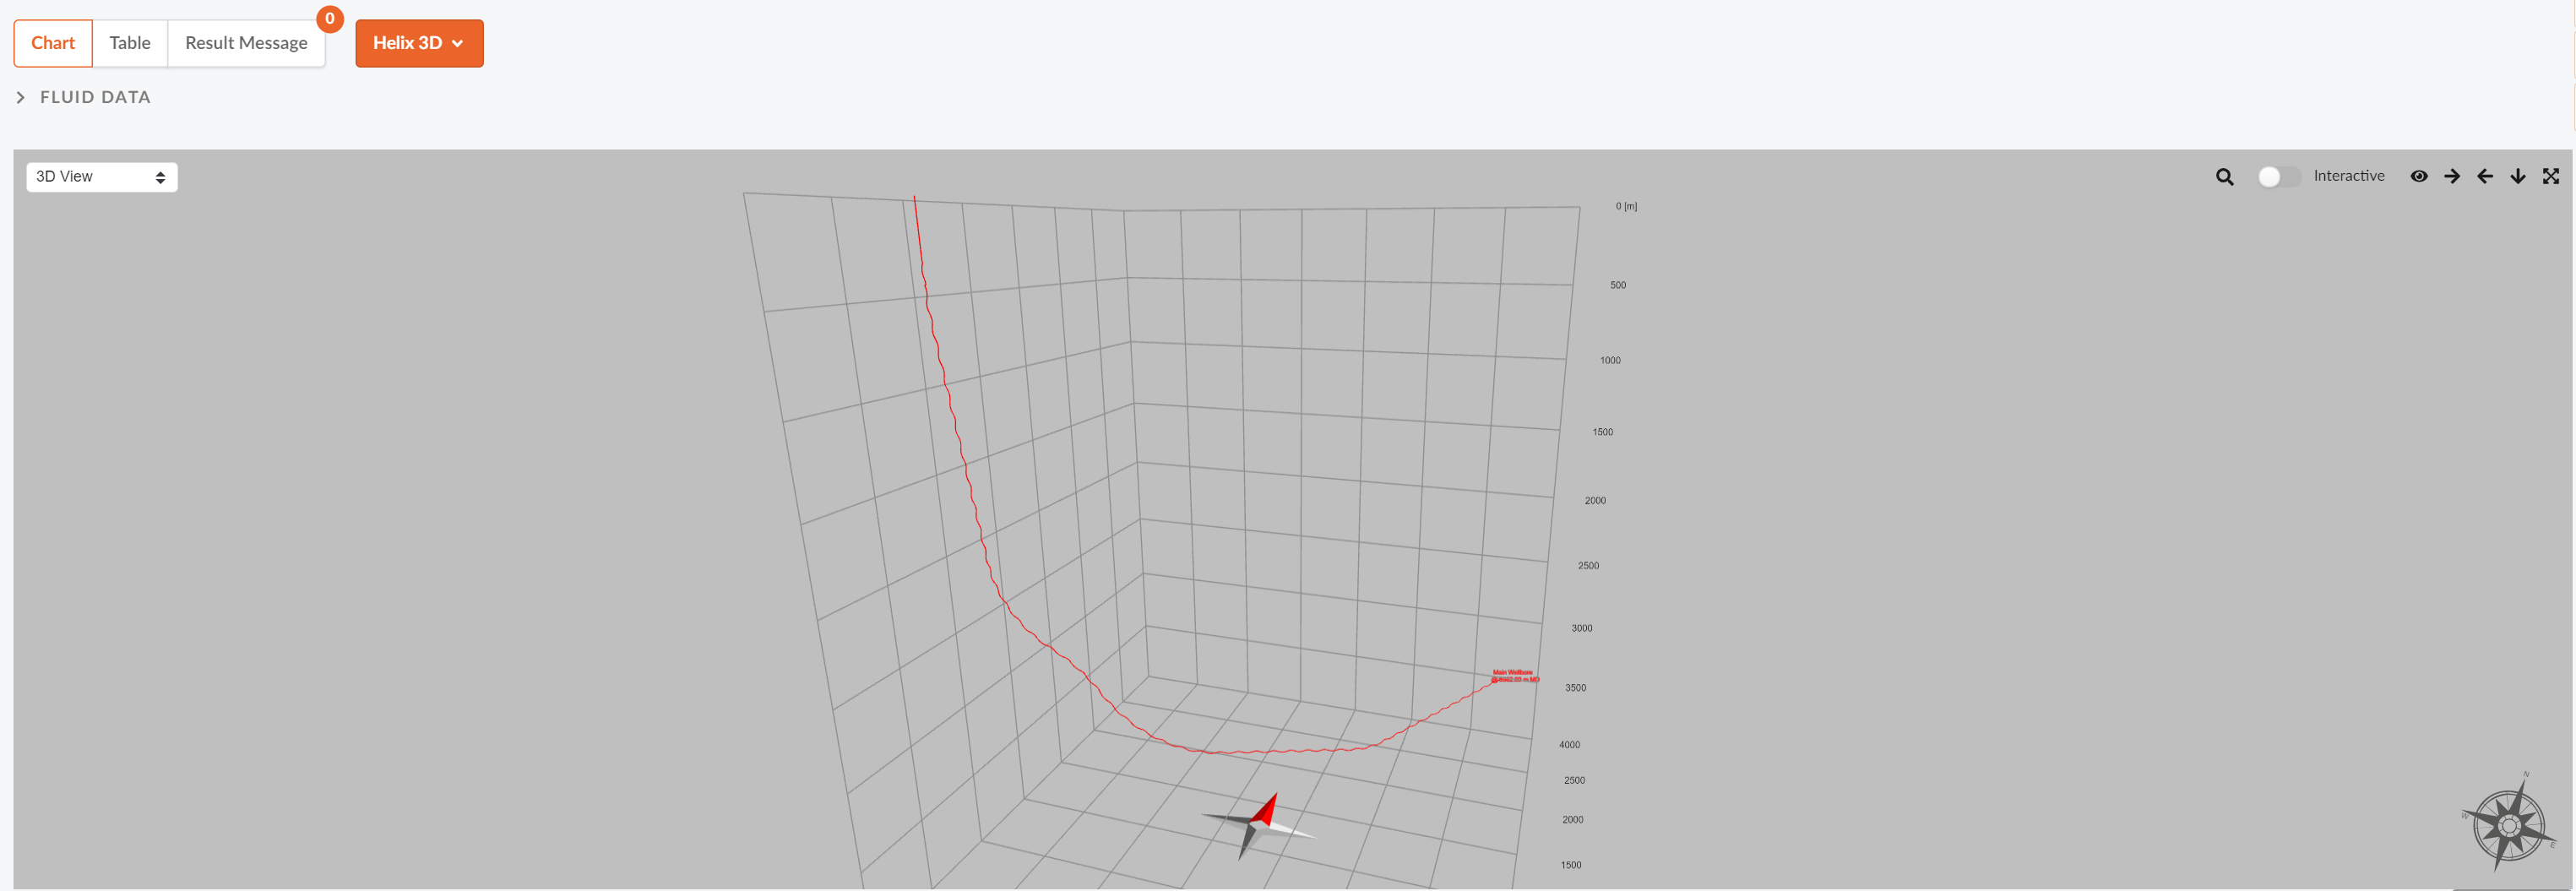
Helix 3D: This plot shows you your well trajectory in a 3D view. This plot will also show the side forces acting on the drill pipe and tortuosity if it is simulated.