Plot and Report
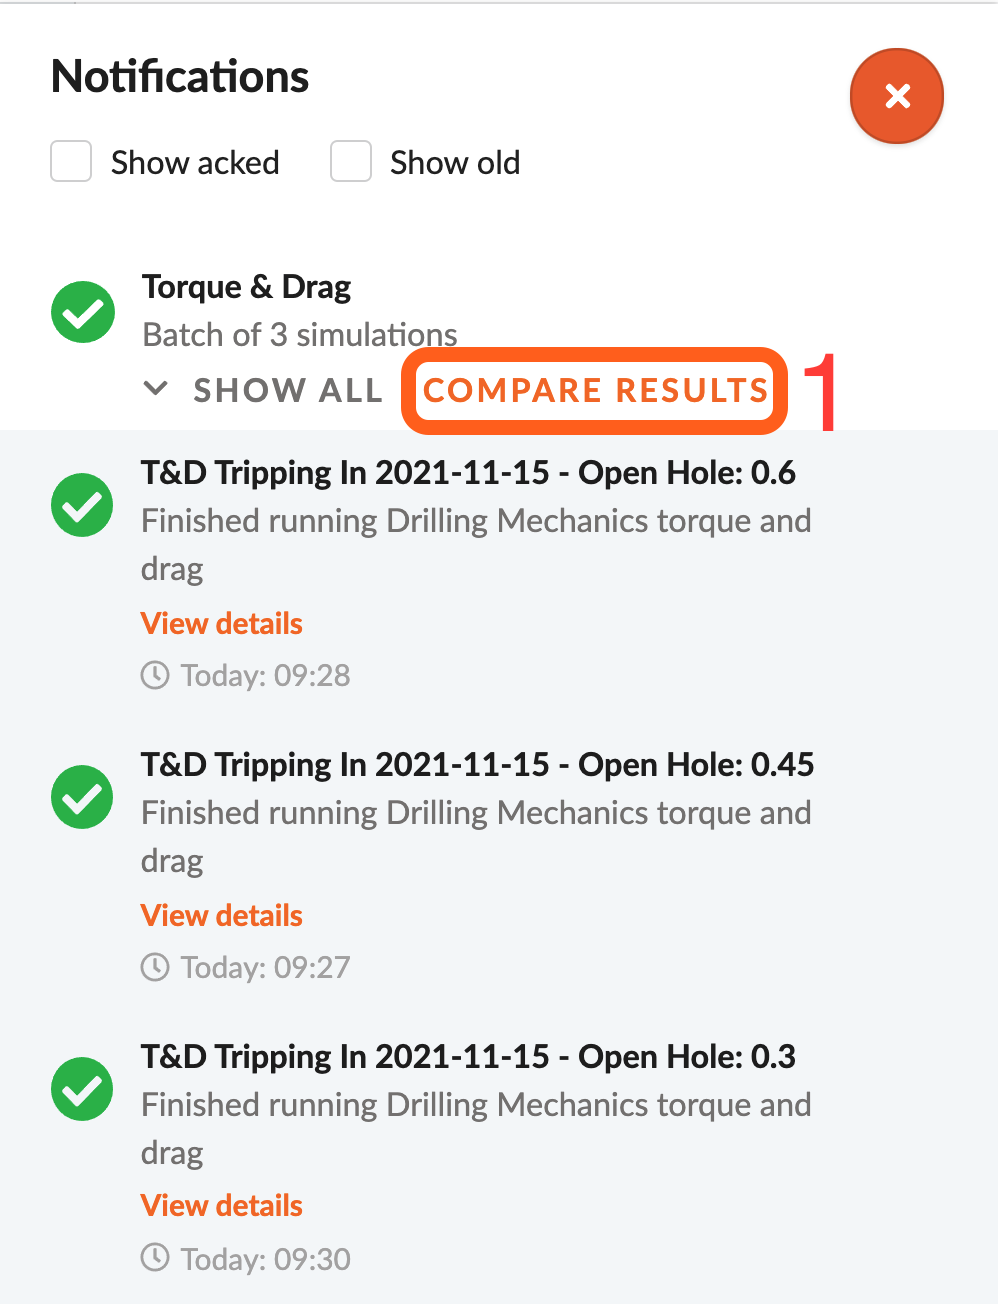
When Sensitivity Analysis (different value scenarios) is run on any of the input values, multiple simulations will be run in parallel in the cloud. Choose to Compare Results (1).
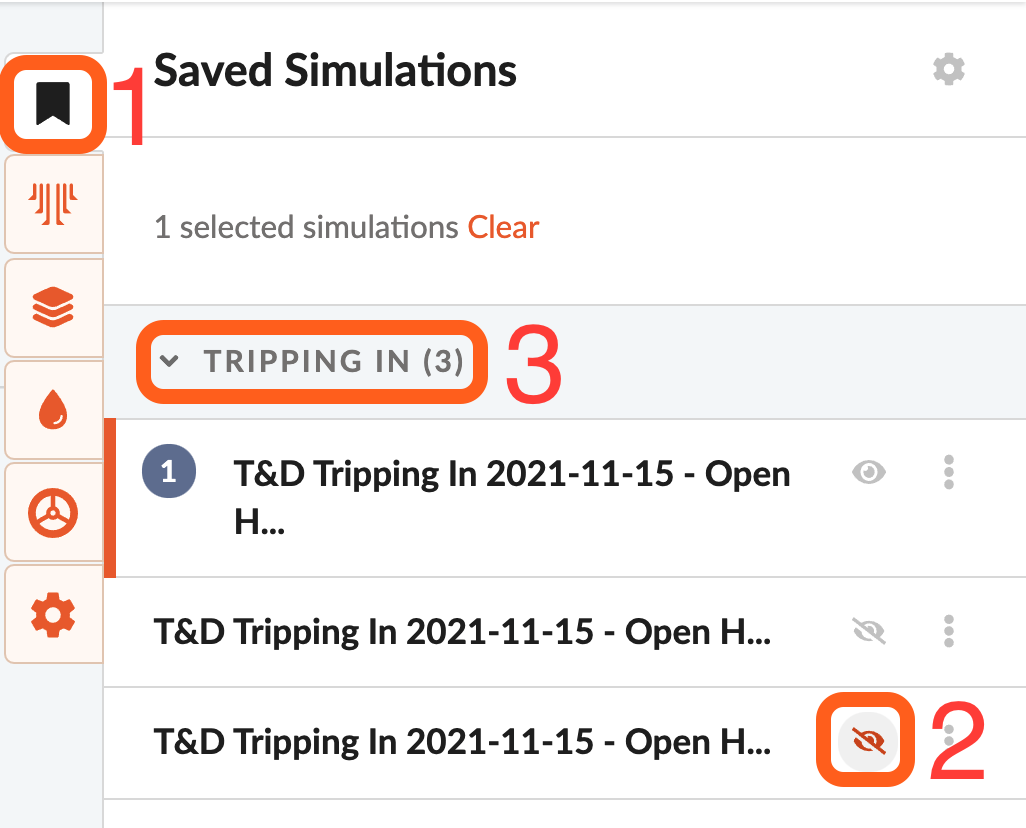
Otherwise, open Saved Simulations (1) to plot any of the simulations. Set to visualize (2) any of the chosen simulations filtered by mode (3).