Summary & Charts
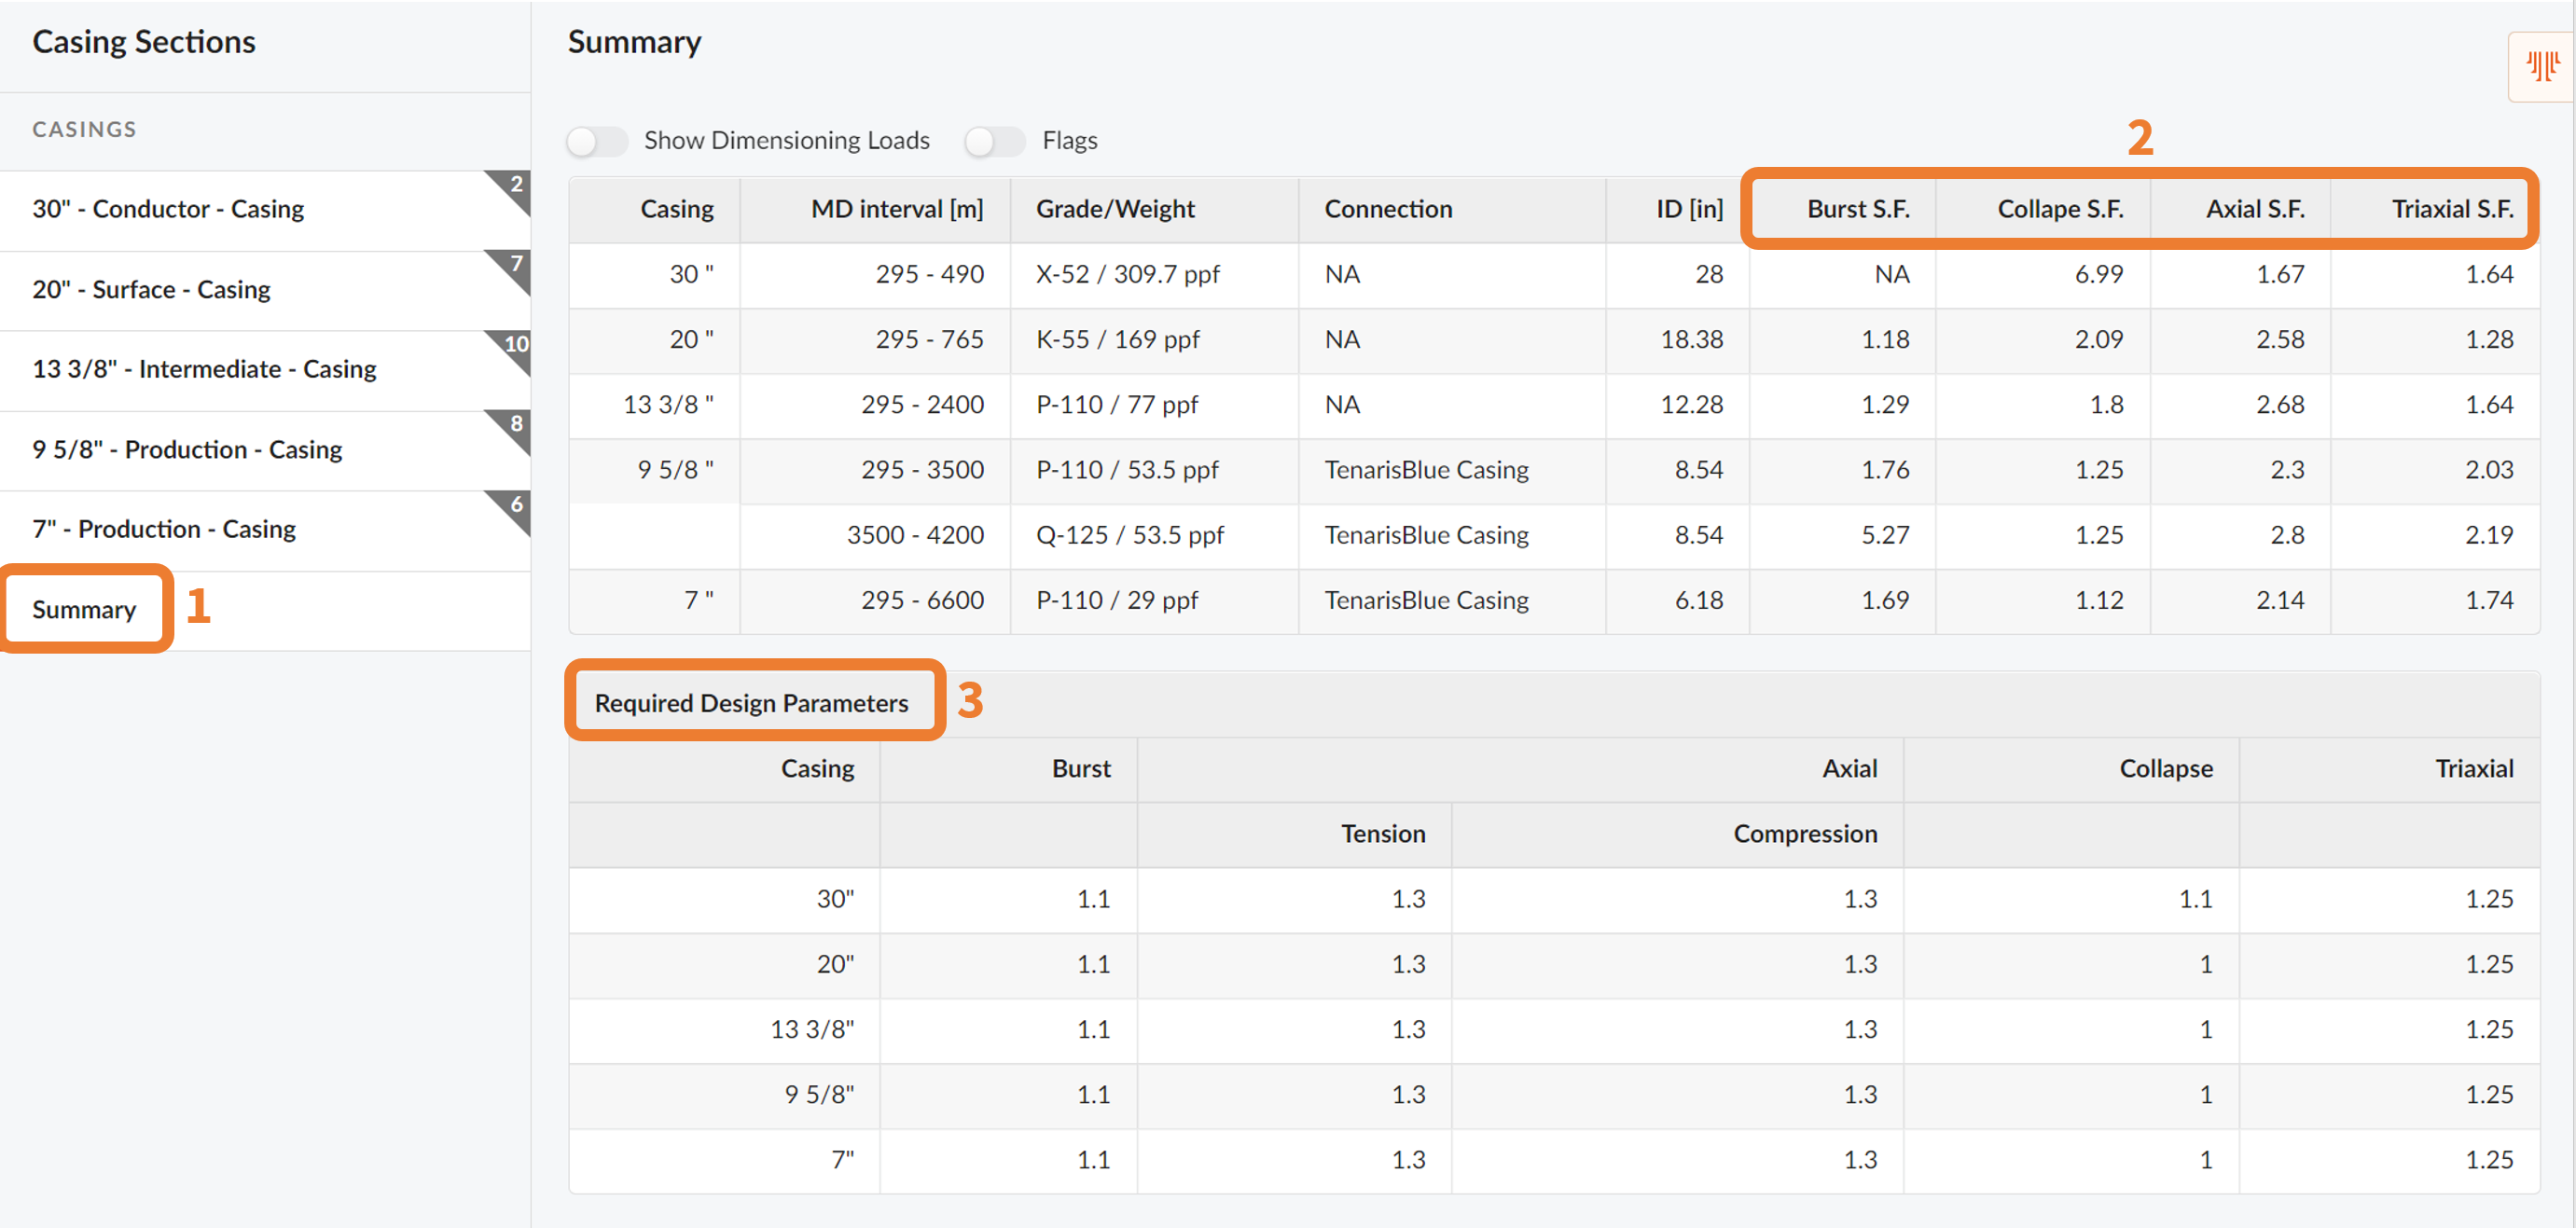
Once your internal and external pressure profiles has been set together with your temperature profile, you can check the safety factors (2) and the required design parameters (3) of the different loads in the Summary tab (1).
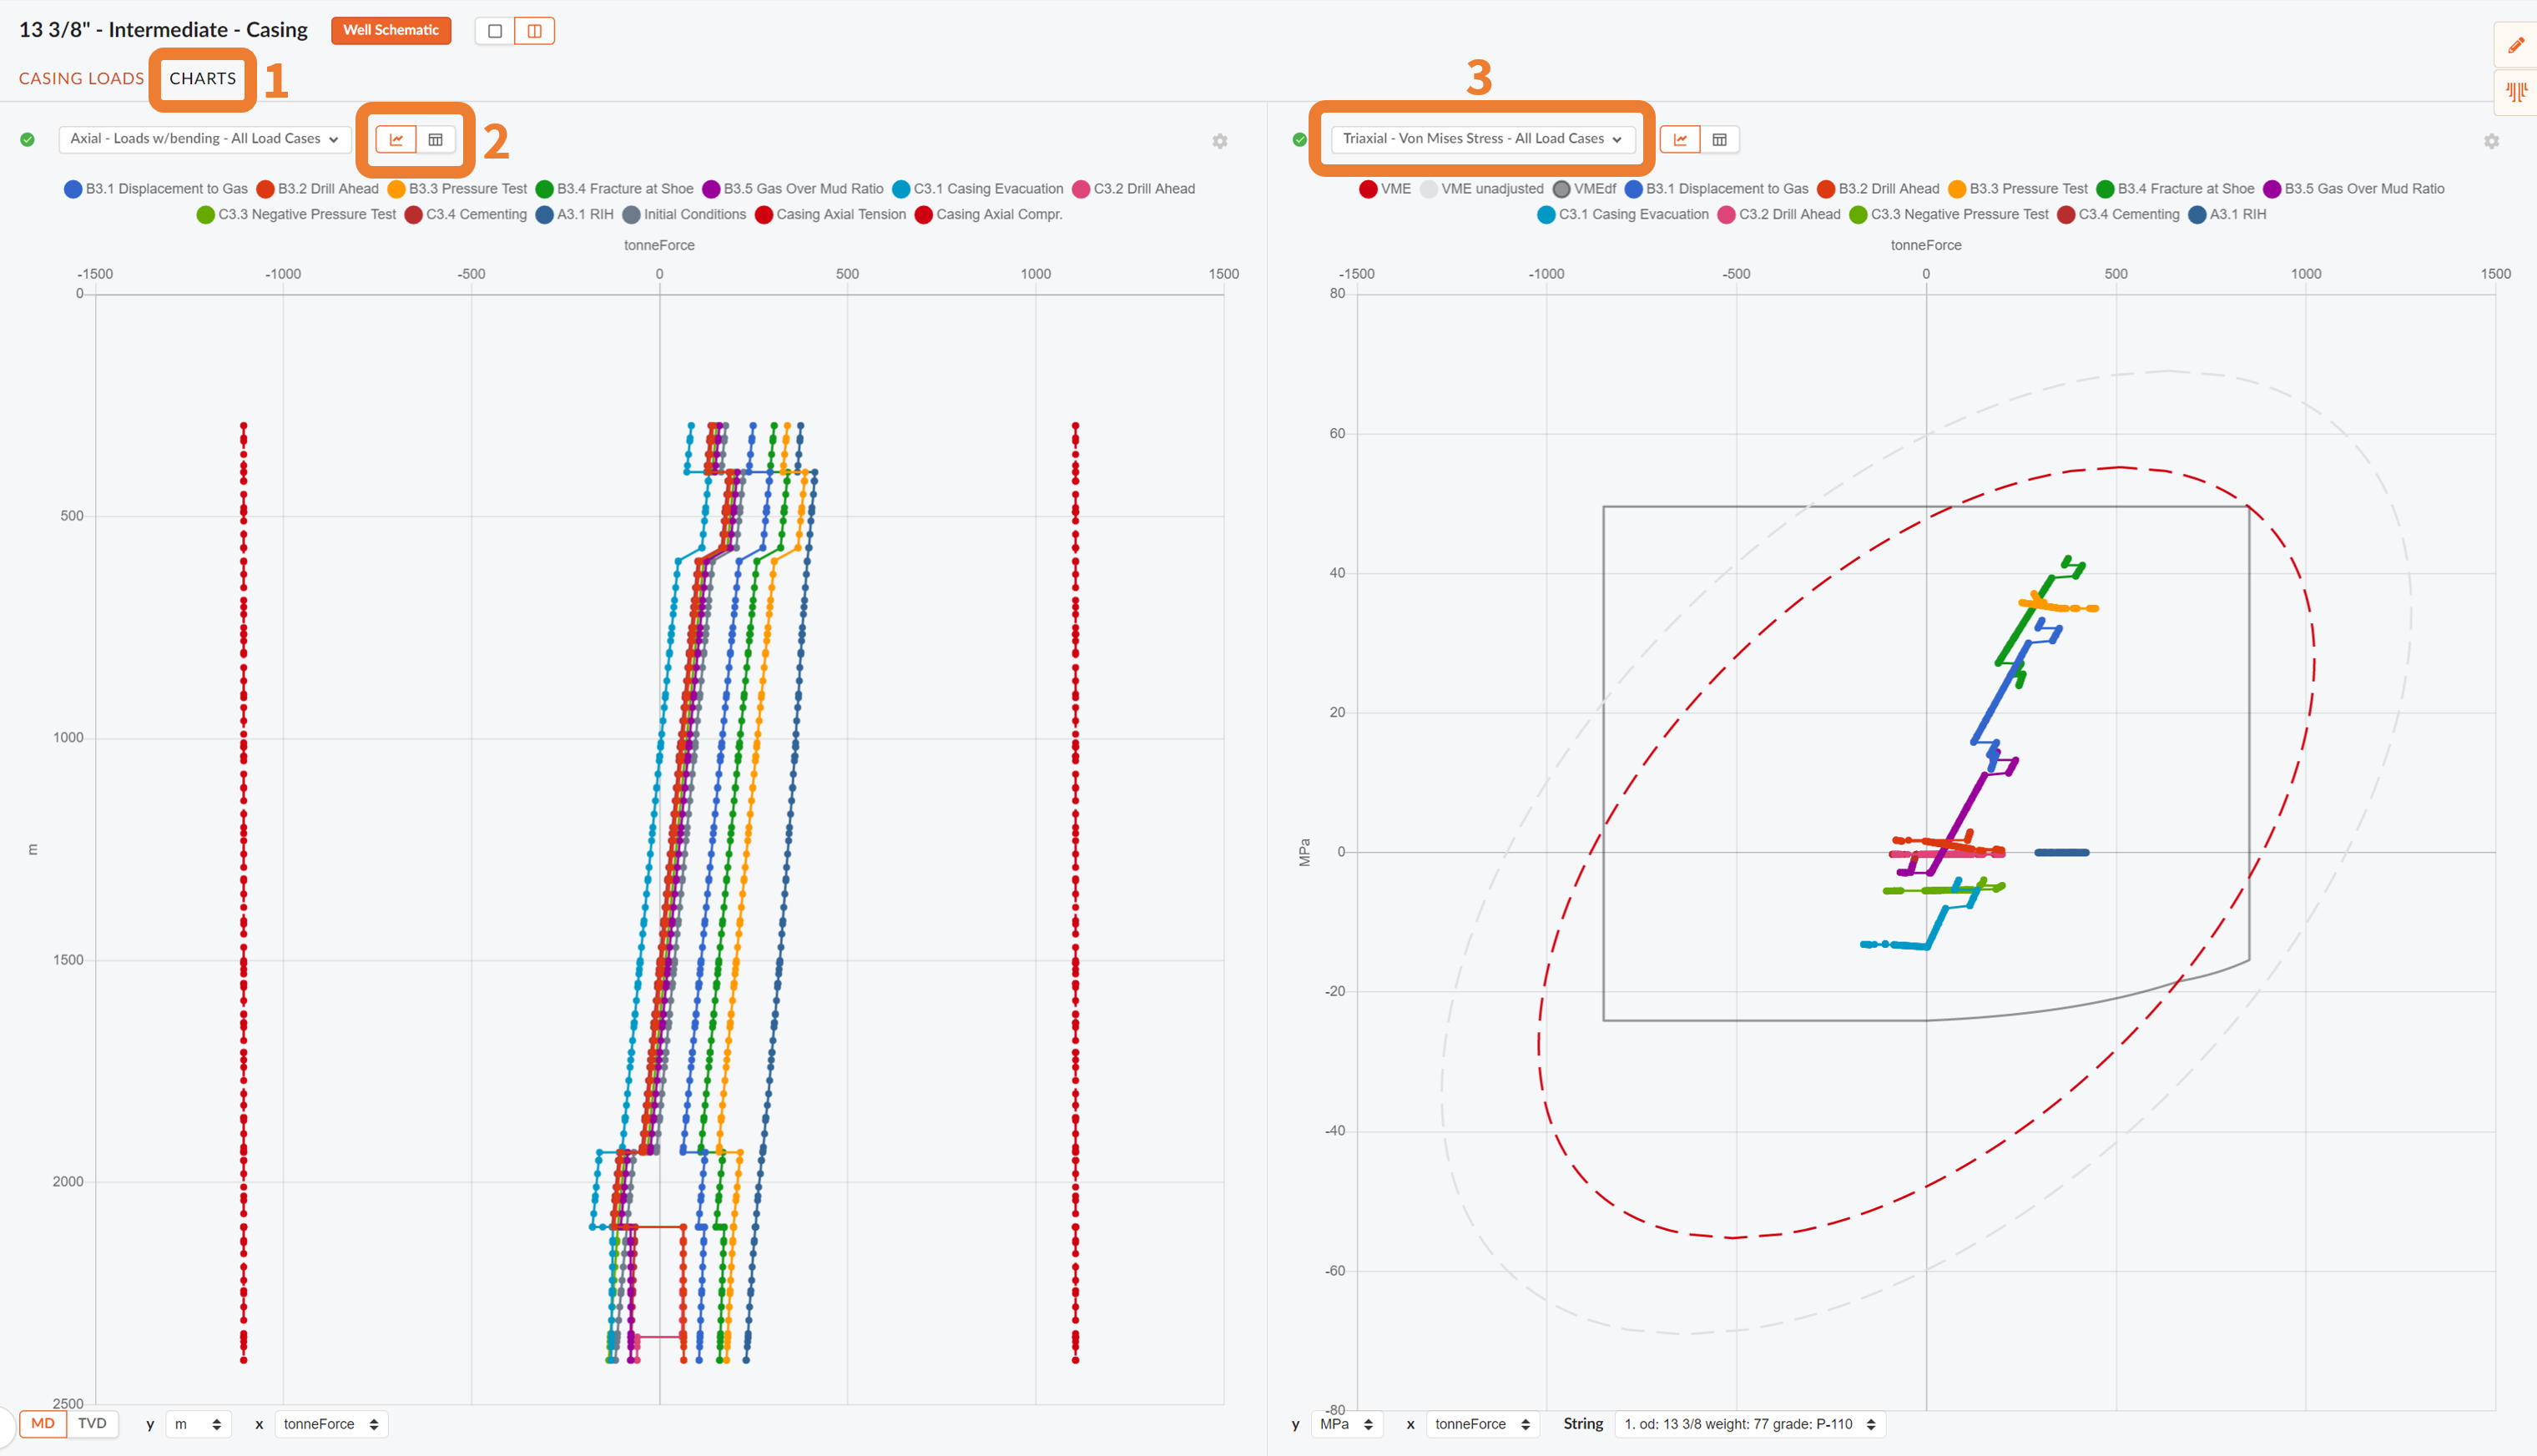
A Charts tab (1) will allow you to plot your load case results. Here, you can view results from all applied load cases. You may select the number of different charts you want to look at in one view; either one or two (2). Related to each chart is a dropdown menu that lets you specify which results you want to be plotted and displayed (3).